
OVNPM 1.5.2 - Performance Agent for NonStop Display Agent Guide

Correlating Curves: SystemInsight 137
11 Correlating Curves: SystemInsight
11-1 Correlation
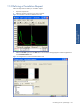
The correlation feature helps you to determine the cause or effect of unusual situations that appear in a
SystemInsight view. This feature is a completely automatic, investigative tool that quickly helps you identify the
areas you need to explore.
This feature is not available in the Distributed OVNPM (DSV) access mode.
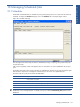
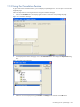
Correlation assists you to find curves that exhibit similar behavior patterns at a particular moment in time. Some
of these curves may represent the cause of an unusual condition in a SystemInsight curve. Other curves may
represent the consequence of this same condition.
For example, suppose there is an unusual variation in a SystemInsight curve. Depending on the situation, you
might select a peak or a flat line. You define your correlation request, and the result is a list of metrics. The
correlation feature displays these metrics as curves.
Each curve has a correlation coefficient that represents the degree of similarity to the original curve. The
correlation coefficient is expressed as a percentage and can be positive or negative. A positive coefficient
indicates that the curve behaves in a similar way as the original curve, and varies in the same direction. A
negative coefficient indicates that the curve behaves in a similar way as the original curve, but varies in the
opposite direction. By analyzing the curves displayed by the correlation feature, the user finds the cause and
effect of unusual situations.
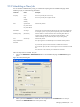
For example, you observe high CPU use in your system. To identify the person responsible for this situation, you
could correlate the metric Cpu-Busy.% with the domain USER. To examine the consequences of this situation on
other parts of your system, you could correlate the same metric with domains such as DISC or LINE.
For using the correlation feature, you must be in the Expert Mode.
Correlating Curves:
SystemInsight