
OVNPM 1.5.2 - Performance Agent for NonStop Display Agent Guide

Correlating Curves: SystemInsight 140
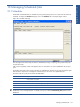
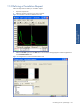
4. Select the metric to investigate in the Metric box.
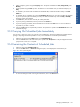
5. Select the time period to examine. In the Correlation Pattern area, the white-shaded area indicates a time
period before and after the curve variation.
This parameter allows you to define a correlation search with a limited number of time values. You can
decrease or increase the time period using the arrow buttons. You can also centrally position the time
interval around the selected variation by dragging the white-shaded area to the desired location.
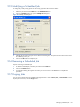
6. In the Similarity box, enter a minimum correlation ratio between the original curve and the resulting curves
of the investigation.
The minimum correlation ratio is expressed as a percentage. To display the curves with only the highest
degree of similarity to the original curve, enter a percentage greater than 90.
7. In the Result Size box, enter the maximum number of metrics you want to display.
8. In the Domains to Include box, select the domain(s) from the list of domains that you want to investigate.
9. Click on the Correlate button. The correlation result is displayed in the Correlation Result box.
NOTE: Choose a time period with sufficient borders around the selected curve variation. A time interval that is
too narrow might not result in any correlation curves due to a lack of data. A time interval that is too large
might result in the examination of too much data before any correlation curves are displayed.