
OVNPM 1.5.2 - Performance Agent for NonStop Display Agent Guide


Correlating Curves: SystemInsight 141
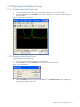
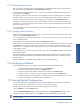
11-4 Using the Correlation List
When a correlation request is completed, the list of metrics that meet the request criteria are displayed in the
Correlation Result box.
The first metric on the list is the original curve with a correlation ratio of 100. The remaining metrics are listed in
the order of their correlation to the original curve. The placement of a metric on a list depends on the absolute
value of its correlation ratio. You can sort correlation results by the Score, Metric, or Unit name.
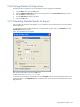
In some cases, only the original metric is displayed in the Correlation Result box. In this case there are no curves
that correlate to the original curve, or the selected time period was not large enough.
By default, OVNPM displays the resulting curves using the Automatic scale. This scale displays the highest curve
value, which makes it easy to view correlations.
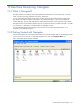
Figure 11-5 Correlation Result
Correlating Curves:
SystemInsight