
OVNPM 1.5.2 - Performance Agent for NonStop Display Agent Guide


Correlating Curves: SystemInsight 142
11-5 Displaying Correlation Curves
11-5-1 Displaying Results Graphically
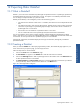
1. From the list of metrics, select the original curve and the correlation curves you want to display.
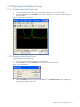
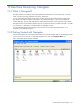
2. Click on the Open button. The Correlation result window displays the curves that have similar variations to
the original curve.
Figure 11-6 Correlation result Window
11-5-2 Displaying Resulting Curves
Steps for displaying the resulting curves:
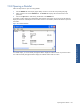
1. Verify that no curve has been selected from the list of metrics.
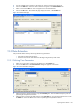
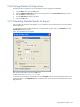
2. From the Curve menu, select the Scale option. This displays the Scale dialog box.
Figure 11-7 Scale Dialog Box
3. Select the Automatic check box and click on the OK button. The Correlation result window redisplays the
resulting curves using the same scale.