
OVNPM 1.5.2 - Performance Agent for NonStop Display Agent Guide


Correlating Curves: SystemInsight 143
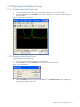
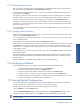
Figure 11-8 Correlation result Window
11-6 Copying Correlation Results to Dashboard
A global dashboard displays multiple views in a single window.
For details, refer to the Organizing Views in a Window topic.
You can copy a view to a dashboard. This can have either of the following results:
• If the dashboard is currently open, the view is added to its display immediately.
• If the dashboard is closed, the view is added to the dashboard’s definition and is displayed the next
time the dashboard is opened.
Follow the steps below to copy the graphical results of a correlation request to a dashboard:
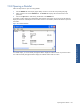
1. Select the curves displayed in the Correlation Result box in the Correlation tab page.
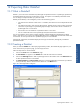
2. Click on the Copy to Dashboard button. The Copy to Dashboard dialog box opens.
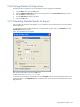
Figure 11-9 Copy to Dashboard Dialog Box]
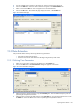
3. Select an existing user-defined dashboard from the Dashboards list. You can also create a new dashboard
using the Create button.
4. Click on the OK button. The correlation results appear as view when you open the selected dashboard.
Correlating Curves:
SystemInsight