
OVNPM 1.5.2 - Performance Agent for NonStop Display Agent Guide

Dashboards 40
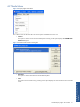
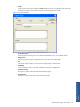
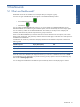
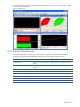
A dashboard normally displays all individual elements simultaneously. However, you have the option to display
one or several view(s) at a time.
Figure 5-1 Dashboard
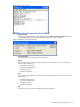
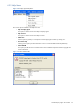
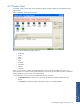
5-2 Predefined Dashboards
Predefined dashboards are created on the server. By default, OVNPM has eight predefined dashboards.
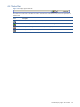
The following table lists the predefined dashboards appearing on the Dashboard desktop window.
Dashboard Description
Principal Resources Displays resources such as Disks, Line, Netline, Memory, and TMF in a live time
reference.
Most Consuming Processes Displays the processes that use the most CPU time for all CPUs in a live time
reference.
Weekly CPU-Busy Displays the CPU-Busy of the node for 8 days.
Weekly Highest CPU Busy Displays the highest CPU-Busy of the node for 8 days.
Weekly Lowest Free Memory Displays the lowest CPU-Busy of the node for 8 days.
Weekly Low-Pin Processes Displays the low-pin processes number of the node for 8 days.
Weekly High-Pin Processes Displays the high-pin processes number of the node for 8 days.
Monthly CPU Availability Displays the CPU availability for the current month.