
OVNPM 1.5.2 - Performance Agent for NonStop Display Agent Guide

Dashboards 41
5-3 Opening a Dashboard
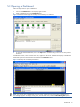
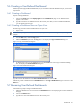
Follow the steps below to open a dashboard.
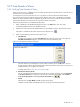
1. Click on the Dashboard tab in the Display Agent window.
2. Select a dashboard icon in the Dashboards area.
Figure 5-2 Dashboard Tab Page with Monthly CPU Availability Icon Selected
3. To open the selected dashboard, click on the Open Button. Double clicking on the icon can also perform
this action.
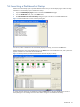
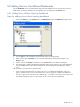
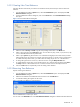
A dashboard window, which contains each view, appears on the screen. OVNPM also displays a dashboard
toolbar that represents commands from the Dashboard and Window menus.
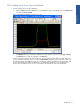
Figure 5-3 Monthly CPU Availability Dashboard
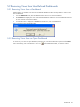
NOTE: You cannot open a dashboard if units are missing. If there are units missing from a dashboard, an
error message appears. To display missing units, from the Tools menu, select the Show Missing Units option.
Dashboards