
OVNPM 1.5.2 - Performance Agent for NonStop Display Agent Guide

Using Views: SystemInsight 70
6-7 Display Modes
A view can be displayed in any of the modes listed in the table below.
Mode Description
Bar Displays the last 5 values of each metric as a separate horizontal bar.
Curve Displays individual metric values as separate curves with the same scale.
Gauge Displays each metric as an automotive-type gauge. The gauge shows the data value as an area filled
with a color or a pattern.
Layer Builds an area chart in the form of layered curves. The areas between the layers are filled with color
or patterns to highlight relative differences.
Plot Displays a chart of metric values around a line plotted by OVNPM.
Choose the display mode that best suits the way you would like to see the information. For example, one set of
metrics may be meaningful when viewed, as curves while another, such as distribution, may be best understood
when displayed in layered mode. Data concerning resource utilization has a test visual impact when viewed as
automotive type gauges.
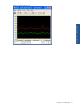
The Menu bar contains a menu title for the view’s current display mode. For example, if the current view display
mode is gauge, the menu title Gauge appears in the Menu bar. Each mode specific menu contains commands
that customize characteristics unique to that display mode such as its appearance.
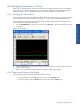
6-7-1 Changing the Display Mode
When you open a view it returns to its most recent display mode. This procedure explains how to change the
display mode.
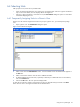
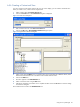
1. From the Available Views list, select a view and click on the Open button.
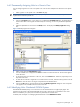
2. In the displayed view window select the Modes option from the Options menu.
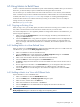
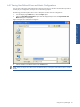
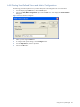
3. A mode selection submenu appears. Choose a new graphic mode from the submenu. Display Agent
reformats the data to fit the new graphic mode.