
OVNPM 1.5.2 - Performance Agent for NonStop Display Agent Guide

Using Views: SystemInsight 71
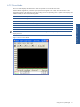
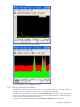
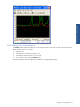
6-7-2 Curve Mode
The curve mode displays individual metric values as separate curves with the same scale.
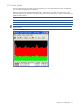
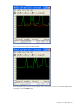
OVNPM builds a legend box, whenever space permits. If the legend is not visible, resize the window so the
legend box appears. The legend lists each metric along with its corresponding color or pattern in the display and
additional data; as shown in the following table:
Label Description
A Average of all interval values
V Exact value for a specific time interval
S Scale selected for the display
M Marker, if one is in use
NOTE: The exact amount of data that can be shown within a legend box depends upon the resolution of the
display terminal
Figure 6-10 Curve View Mode
Using Views: SystemInsight