
OVNPM 1.5.2 - Performance Agent for NonStop Display Agent Guide

Using Views: SystemInsight 72
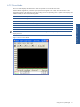
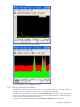
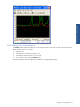
6-7-3 Layer Mode
The layer mode builds an area chart in the form of layered curves. The areas between the layers are filled with
color or patterns to highlight relative differences.
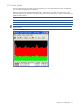
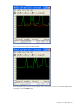
Whenever space permits, OVNPM builds a legend box. If the legend is not visible, resize the window so the
legend box appears. The legend lists each metric along with its corresponding color or pattern in the display and
additional data as follows:
Label Description
A Average of all interval values
V Exact value for a specific time interval
NOTE: The exact amount of data that can be shown within a legend box depends upon the resolution of the
display terminal
Figure 6-11 Layer View Mode