
OVNPM 1.5.2 - Performance Agent for NonStop Display Agent Guide

Using Views: SystemInsight 73
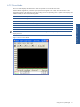
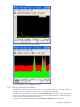
6-7-4 Displaying Values for a Specific Interval
Follow the steps below to display the actual values for any interval in Layer or Curve display mode.
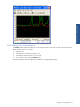
1. Click a specific point in the displayed view. A vertical line appears at that point. This line marks a specific
time interval.
Figure 6-12 Curve View with a Point Selected
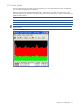
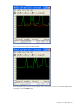
2. The time of the interval is shown above the line (for example, 5:00:30 AM). You can adjust the interval, if
necessary, either by clicking on another point or by dragging the vertical line with the left and right cursor
keys. The legend box displays the actual values preceded by V.
To remove the vertical line, click on it. As a result, the corresponding actual values are removed from the legend.
Using Views: SystemInsight