
OVNPM 1.5.2 - Performance Agent for NonStop Display Agent Guide

Using Views: SystemInsight 74
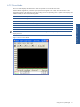
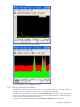
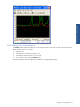
6-7-5 Plot Mode
The plot display mode presents data as points scattered around a reference line. The slope of the line is plotted
from two metric values. The equation used to plot the line is displayed above the plot diagram. By default,
OVNPM uses the first two metrics in the view definition to plot the line.
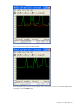
OVNPM builds a legend box, whenever space permits. If the legend is not visible, resize the window so the
legend box appears. The following legend lists two metrics used to plot the line and additional data.
Heading Explanation
X Metric plotted on the X axis
Y Metric plotted on the Y axis
E: Estimates of the X and Y values for any selected point on the line.
NOTE: The exact amount of data that can be shown within a legend box depends upon the resolution of the
display terminal.
Figure 6-13 Plot View Mode