
OVNPM 1.5.2 - Performance Agent for NonStop Display Agent Guide

Using Views: SystemInsight 77
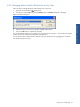
6-9 Customizing Appearance of Views
OVNPM provides a set of controls to customize the appearance of views. The following table lists the controls,
describes their purpose, and display modes.
Control Purpose Display Modes
Area Paints colors and/or patterns in areas between curves for emphasis.
The colors and/or patterns are defined in active style sheet.
Curve
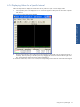
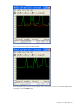
Background Pattern Defines a set of horizontal lines or grid lines to make values on a
graph easier to interpret.
Curve, Layer Plot
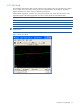
Hidden Temporarily hides one or more metrics to make a view easier to read. Curve
Marker Places a reference line at a user defined level on the display. This
marker makes it easier to see data that reaches that level.,
Bar Curve
High Mark Sets a starting point for a shaded area at the top of a gauge Gauge
Scale Value that determines the range of the data display Bar, Curve, Layer, Gauge
Style Sheet Describes the colors and patterns used for screen display/hard copy. All Modes
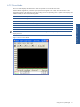
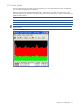
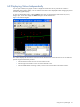
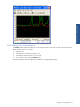
6-9-1 Applying Colors to Areas Between Curves
You can apply colors and patterns to emphasize the space between individual metrics on a view in the curve
mode. The active style sheet dictates the colors and patterns to use.
To apply colors or patterns to areas between curves, select the Area option from the Curve menu. When this
option is active, the choice Area appears with a check mark.
Using Views: SystemInsight