
OVNPM 1.5.2 - Performance Agent for NonStop Display Agent Guide

Analyzing Trends: SystemTrend 99
7-2-1 History Views
History views report activity over a day, a month or the year.
Report Type X-Axis Interval Values at Each Point
Day One Hour (1 - 24) 3 values per hour: Minimum, Average and Maximum
Months One Day (1 - 31) 5 values per day: Minimum, Minimum Hourly Average,
Average, Maximum hourly Average and Maximum
Year One Month (1 - 12) 5 values per month; Minimum, Minimum Daily Average,
Average, Maximum Daily average and maximum
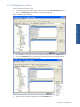
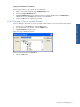
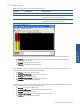
Figure 7-1 Trend History View
A Trend Day view shows 24 hours and 3 values per hour: The Average, The Minimum and The Maximum.
• The Minimum is the lowest minute for the hour. Each minute’s trend makes an average and keeps the
lowest average as the minimum.
• The Average is average of values for one hour.
• The Maximum is the highest minutes for the hour.
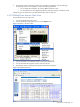
A Trend Month view shows 31 days and 5 values per day: The Minimum, The Minimum Hourly Average, The
Average, The Maximum Hourly Average and The Maximum.
• The Minimum is the lowest minute of the day.
• The Minimum hourly average is the lowest hour of the day.
• The Average is the average for the day.
• The Maximum hourly average is the highest hour of the day.
• The Maximum is the highest minute of the day.
A Trend Yearly view shows 12 months and 5 values per month: The Minimum, The Minimum Daily Average, The
Average, The Maximum Daily Average and The Maximum.
• The minimum is lowest minute of the month
• The minimum daily average is the lowest day average of the month.
• The average is average for the month
• The maximum daily average is the highest day average of the month.
• The maximum is the highest minute of the day.
Analyzing Trends:
SystemTrend