HP Performance Agent for NonStop Navigator Guide Part number: 528962-005 Fifth edition: 12/2008
Legal notices Hewlett-Packard makes no warranty of any kind with regard to this manual, including, but not limited to, the implied warranties of merchantability and fitness for a particular purpose. Hewlett-Packard shall not be held liable for errors contained herein or direct, indirect, special, incidental or consequential damages in connection with the furnishing, performance, or use of this material.
Contents Before You Begin ..................................................................................................................................... 4 Audience ................................................................................................................................................ 4 Goals of Documentation ........................................................................................................................... 4 Organization ................................
Preface HP Performance Agent for NonStop (OVNPM), formerly known as HP OpenView NonStop Server Performance Management, is an out-of-the-box solution that provides performance monitoring of HP NonStop servers. The software is a natural extension of HP Operations (formerly known as HP OpenView) and provides you with true end-to-end management of your NonStop environment. The various OVNPM Guides provides information about how to get started and use the product.
OVNPM Manuals Manual Description Media OVNPM Concepts Guide Explains OVNPM features, functions, benefits, architecture, and data flow. PDF OVNPM Server Management Guide.doc Explains how to install OVNPM Server components. Also includes the steps for uninstalling OVNPM server components. PDF OVNPM Server Monitoring Guide.doc Explains how to configure OVNPM Server components. PDF OVNPM Display Agent Guide.
1 Navigator: Introduction and Interface 1-1 Introducing Navigator Navigator enables you to analyze critical system performance information on a microscopic level, in real-time mode. It monitors CPU usage, applications, processes and devices. You can request information about specific areas, and then view the results in tabular format on Web pages. Data entries in the table can appear as hyperlinks to more detailed information, which is then displayed on another Web page.
1-2 Navigation Menu The menu displayed on the left side of the Navigator window provides access to various Navigator functionalities. The various options available are: • Dashboard Dashboards display multiple views in a single window. Each dashboard contains a set of views and reports that you can manage as a single unit. Dashboards simultaneously display the individual elements. Alternatively, dashboards display views one at a time in an automatic cycle.
Icons & Hyperlinks The following table explains the targeted area of graphics in the Navigator window. Category General Icon Description Home page of the Navigator and all entities of the system.
Category Icon Description Open Subvolume Browsing Headers Starting From Browsed Files Program, Code 100 RISC, Native Program, Code 700 Saveabend File, Code 130 Navigator: Introduction and Interface File with Code 0 Edit File, Code 101 Measure File, Code 175 Others File Locks Lock Hold Lock Wait Process Currently Locks the File File Locks Process Waits for Lock Release Availability OK Warning Stop Flags Less than 1 Hour Less than 12 Hours Less than 24 Hours Less than 48 Hours Less than 72 Hour
Category Icon Description Checked Unchecked File is Locked 10
2 Working with Navigator 2-1 Prerequisites Before running OVNPM Navigator, ensure that the following tasks have been accomplished: 1. 2. Any Web browser that is compliant with HTTP 1.0, HTML 3.2, JavaScript 1.2, Netscape 4.7 and Microsoft IE 4.0 and higher versions are available. OVNPM Server environment is installed and running on the HP Nonstop Server. For details, refer to the OVNPM Server Guide. 3. The Navigator port should be available outside the firewall on the HP NonStop Managed Host.
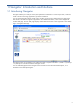
Step B: Logging On When you connect to Navigator you must provide a valid logon and password. Opening the Navigator window displays the Connect to dialog box. Figure 2-1 Enter Network Password Dialog Box Associated with each logon is a profile, which determines the information a user can view. The ADMIN logon has special privileges, and can determine the profiles and passwords of other users. Enter the User Name and Password in the dialog box and click on the OK button.
2-3 Dashboard Dashboards display multiple views in a single window. Each dashboard contains a set of views and reports that you can manage as a single unit. Dashboards simultaneously display the individual elements. Alternatively, dashboards display views one at a time in an automatic cycle. To access the Dashboard information, click on the Dashboard link. This displays the corresponding page. Click on the Top Dashboard link to access the Top dashboard page.
The following example shows selecting both cpu and disc domains for a NonStop Server. Only objects with cpu busy %>=0.1 sec ( 100 msec) are displayed. Figure 2-3 Navigator Top Dashboard Results Dashboards display multiple views in a single window. Each dashboard contains a set of views and reports that you can manage as a single unit. Dashboards simultaneously display the individual elements. Alternatively, dashboards display views one at a time in an automatic cycle.
Disk Metrics Metric Description cpu busy % Percentage of CPU time used by the Disk Processes for the current disk. io busy % Percentage of time that the disc was being used during the sample time. io kbits/s Total number of kilobits written and read during the sampling period. free GB Gigabytes of disc space available on the specified disc. frag # Number of individual free space fragments on the disk. lrgst MB Megabytes of the largest free space fragment on the disk.
AppliDef Metrics Metric Description cpu busy % Percentage of time that the APPLIDEF processes were executing in the CPU. This metric may have a value between 0% and (#cpu * 100%) io kbits/s Number of kilobits per second handled by these APPLIDEF processes during the sample period. This includes sent-bits and returned-bits, as well as received-bits and reply-bits. msg sent Number of messages sent by the APPLIDEF processes to other processes.
2-4 Availability The Availability feature allows you to display the status information of devices and applications. You can monitor the devices configured on your node as well as the processes in your applications. Navigator displays the availability status as: • Running, denoted by the icon, • Stopped, denoted by the icon and • Changed Status, denoted by the icon.
Viewing Application Availability Step 1: Click on the Availability menu option on the left side of the Navigator window. This displays the Availability page. Figure 2-4 Navigator Availability Page Step 2: In the Application page, click on the Application Availability link. This displays the Application Availability page. Figure 2-5 Navigator Application Availability Page Step 3: To request information, enter the parameter values associated with the selected hyperlink in the Application Availability page.
This returns the requested information. Figure 2-6 Navigator Application Availability Results Working with Navigator OVNPM provides an Application Availability example called SYSTEM_BASE. The example provided may not match your system, or contain all the processes you would like defined. To modify the SYSTEM_BASE configuration, follow the steps on the next page.
Editing Application Configuration You can configure an application by: • Giving it a unique name to use as a reference. • Providing the names of the processes that make up the application. NOTE: Only the administrator (ADMIN logon) can modify the list of applications and processes.. Step 1: Click on the Edit Configuration button in the Application Availability page. This displays the text window containing the file content.
2-4-2 Device Availability This function monitors the status of the Disks, Lines and Netline configured on the node. For each device, it shows how many paths are up or down. Depending on the status of the device, the following information may be available.
Viewing Device Availability Step 1: Click on the Availability menu option on the left side of the Navigator window. This displays the Availability page. Step 2: In the Application page, click on the Device Availability link. This displays the Device Availability page. Figure 2-8 Navigator Device Availability Page Step 3: To request information, enter the parameter values associated with the selected hyperlink in the Device Availability page. 1. Select the Node using the Node Field. 2.
Using the Device Filter Using this function, you can select the devices that you want to monitor. Step 1: Click on the Filter devices button in the Device Availability page. This displays the Device Availability Filter page.
Step 2: To choose devices, select the check box for each device and click on the Submit filter button to validate your choices. To stop monitoring a device, deselect the corresponding check box. This displays the information that the device filter has been successfully applied. Figure 2-11 Navigator Device Availability Filter Information Page Step 3: To complete the process of filtering devices, click on the Update status button.
2-4-3 Spooler Status This function shows the status of spoolers on the selected node. Viewing Spooler Status Step 1: Click on the Availability menu option on the left side of the Navigator window. This displays the Availability page. Step 2: In the Application page, click on the Spooler Status link. This displays the corresponding page. The list of spooler collectors and there status is displayed. To view the list of all the spooler jobs click on the Jobs hyperlink.
2-4-4 File Availability This function shows the status of files on the selected node. For each file, it shows if the file is present or absent. Viewing File Availability Step 1: Click on the Availability menu option on the left side of the Navigator window. This displays the Availability page. Step 2: In the Application page, click on the File Availability link. This displays the File Availability page.
This returns the requested information. NOTE: The files that are displayed in the File Availability depend on the configurations in the [FileAvailability] section in the XCFGFIL file. This file is available in the OVNPM Configuration subvolume in the HP NonStop server. For details on how to configure File availability, refer to Chapter 11: Configuring File Scanning in the OVNPM Server Guide.
2-4-5 File Count This function shows the count of files on the selected node. Viewing File Count Step 1: Click on the Availability menu option on the left side of the Navigator window. This displays the Availability page. Step 2: In the Application page, click on the File Count link. This displays the File Count page. Figure 2-16 Navigator File Count Page Step 3: To request information, enter the parameter values associated with the selected hyperlink in the File Count page. 1.
This returns the requested information. Figure 2-17 Navigator File Count Results For details on how to configure File availability, refer to Configuring File Scanning chapter in the OVNPM Server Management Guide. Working with Navigator 29 Working with Navigator NOTE: The files that are displayed in the File Count depend on the configurations in the [FileCount] section in the XCFGFIL file. This file is available in the OVNPM Configuration subvolume in the HP NonStop server.
2-4-6 File Scan This function scans files on the selected node. Viewing File Scan Step 1: Click on the Availability menu option on the left side of the Navigator window. This displays the Availability page. Step 2: In the Application page, click on the File Scan link. This displays the File Scan page. Figure 2-18 Navigator File Scan Page Step 3: To request information, enter the parameter values associated with the selected hyperlink in the File Scan page. 1. Select the Node using the Node Field. 2.
This returns the requested information. NOTE: The files that are displayed in the File Availability depend on the configurations in the [FileScan] section in the XCFGFIL file. This file is available in the OVNPM Configuration subvolume in the HP NonStop server. For details on how to configure File availability, refer to Chapter 11: Configuring File Scanning in the OVNPM Server Guide.
2-5 Activity The Activity feature allows you to display the status information for the CPUs, Processes, Files and User & Group activities. 2-5-1 CPU Activity CPU Activity displays the activity for all the CPUs. For each CPU, it shows the list of busiest processes. Viewing CPU Activity Step 1: Click on the Activity menu option on the Navigator window. This displays the Activity page.
Step 2: In the Activity page, click on the CPU Busy link to access the CPU Activity page. Step 3: To request information, enter the parameter values associated with the selected link. 1. Select the NODE using the Node.CPU field. 2. Select or clear the refresh interval using the Refresh Field. 3. Click on the Submit button. This returns the requested information.
2-5-2 PROCESS Activity PROCESS activity monitors the top processes for the last data collection interval. You can sort the top processes using the following criteria. Cpu Busy Lists the processes on a CPU that used the most CPU time during the last collection interval. It also monitors the Cpu-Busy.% of all CPUs on all nodes Memory-Busy Lists the processes on a CPU that used the most memory pages during the last collect interval.
Step 2: In the Application page, click on any of the PROCESS Activity metrics, like CPU Busy and Memory Busy. This displays the corresponding page. Step 3: To request information, enter the parameter values associated with the selected link. 1. Select the CPU using the cpu field. 2. Select the metric using the corresponding field. 3. Select or clear the refresh interval using the refresh field. 4. Select the number of processes per CPU which you want to be displayed using the number field.
5. Click on the Submit button. This returns the requested information.
2-5-3 FILE Activity The FILE Activity function returns the busiest files belonging to selected disks. The selected disk can be a virtual disk. The list of files is sorted in descending order by the number of IOs metrics. filename Contains the filename. file type U: unstructured file R: relative file E: entry sequenced file K: key sequenced file IO Number of physical IOs performed on the file during the last collect interval.
Step 3: To request information, enter the parameter values associated with the selected link. 1. Select the Node using the Node Field. 2. Use the Disk Selection Field to select a disk and all its files. To select disks, you can enter the following characters as wildcards: • $*.*.
2-5-4 TCPIP and UDP Connections Step 1: Click on the Activity menu option on the Navigator window. This displays the Activity page. Step 2: In the Application page, click on the Connections link. This displays the Socket opens page. Step 3: To request information, enter the parameter values associated with the selected link. 1. Select the transport using the corresponding field. 2. Select or clear the refresh interval using the Refresh Field. 3. Select the number using the corresponding field. 4.
2-5-5 DISK and FILE Locks The DISK and FILE Lock function browses the selected disk and display a list of locked files. This function also returns lock information on a file if it is currently locked and proposes a direct link to processes involved by the lock. DISK Locks Files Locked List of locked files on this volume. Locks Number of locks on this file. Participants Number of processes and transitions that lock the file. Holder Number of participants that hold a lock.
Step 3: To request information, enter the parameter values associated with the selected link. 1. Select the Node using the Node Field. 2. In the File Field, enter a valid physical or virtual volume name or file name. 3. Select or clear the refresh interval using the Refresh Field. 4. Click on the Submit button. This returns the requested information.
2-5-6 USER & GROUP Activity Using this function, the busiest processes that belong to a user or group for each CPU can be displayed. On the response page, the server returns for each CPU, the following information. • The sum of CPU-Busy for the busiest processes that belong to a user or group, displayed with the red bar graph. • The CPU-Busy of the other processes is displayed as a blue bar graph with a link to more information on the CPU.
This returns the requested information.
2-6 Events 2-6-1 Process Transition The Process Transition activity detects the following transitions. CpuLoop MemLoop Detects any process that is using excessive CPU time and whose priority is falling CpuLoop . processes are designated by the symbol Detects processes that are acquiring excessive memory pages MemLoop processes are designated by the symbol NewProcess ProcessEnd StChange UsrChange . Detects the latest started processes.
Step 2: In the Events page, click on the Process Transitions link displayed under Process Transitions. This displays the Process Transition page. Figure 2-34 Navigator Process Transition Page 1. Select the Node using the Node Field. 2. Select or clear the refresh interval using the Refresh Field. 3. Click on the Submit button. Working with Navigator Step 3: To request information, enter the parameter values associated with the selected link. This returns the requested information.
2-6-2 Pending Processes Pending Processes show all processes that are currently in the following states: DebugBreakpoint, DebugRequest, DebugTrap, InspectBreakpoint, InspectMemBreakpoint, InspectRequest, InspectTrap, Saveabend, Suspend, and Terminating. Viewing Pending Processes Step 1: Click on the Events menu option on the Navigator window. This displays the Events page. Step 2: In the Events page, click on the Pending Processes link displayed under Pending Processes.
This returns the requested information.
2-7 Zoom 2-7-1 Process Info Process Info returns detailed information on the selected process and its opened files and devices. Viewing Process Info Step 1: Click on the Zoom menu option on the Navigator window. This displays the Zoom page. Figure 2-38 Navigator Zoom Page] Step 2: In the Zoom page, click on the Process Info link. This displays the Process Info page.
Step 3: To request information, enter the parameter values associated with the selected link. 1. Select the Node using the Node Field. 2. Select the refresh mode 'Detail' and 'Maximum'. 3. Select or clear the refresh interval using the Refresh Field. from the selected list. Note the auto refresh mode does not work with the level Select the level of information to return: 4. • Short: displays information on the process. • Medium: displays information on the process and on its opened devices.
Detailed information and performance metrics returned transition Transition (if any) during the last collection interval (loop, up, down, state change) cpu pin CPU and process identification number prs name Process name for named process, empty for a process without a namep indicates that the process is a primary process -b indicates that the process is a backup process last cpu busy Percentage of CPU busy during the last collection interval avrg cpu busy Average cpu time calculated from the proces
If the processes has been opened by other processes, additional information is returned to the opener processes. cpu,pin Pid of the opener process. prs name Opener process name. program Program file executed by the opener process. measured since Measurement period expressed in days(d), hours(h), minutes('), seconds("). Busy Percentage of time a process is busy for I/O operations during the measurement period.
states Process state unallocated, starting, runnable, suspended, dbgbrkpt (debug breakpoint), dbgtrap (debug trap), dbgreq (debug request), inspmembrkt (inspect memory breakpoint), inspbrkpt (inspect breakpoint), insptrap (inspect trap), inspreq (inspect request), saveabend, terminating grp,usr Process owner programfilename Program file executed by the process hometerm Process home terminal wstate Wait state: wait on pon (CPU power on), iopon (I/O power on), intr (interrupt), linsp (inspect event),
2-7-2 File Info This option returns detailed information about a selected file and its opening processes (for a datafile), or processes that execute the file that is a program file. Viewing File Info Step 1: Click on the Zoom menu option on the Navigator window. This displays the Zoom page. Step 2: In the Zoom page, click on the File Info link. This displays the File Info page. Step 3: To request information, enter the parameter values associated with the selected link. 1.
This returns the requested information.
If the file is opened, the following information is also available: • If the file is a program (file code 100 or 700), information about processes that execute the program file is returned. • If the file is not a program (other file code), information about processes that opened the file is returned. NOTE: The maximum number of processes returned in these two cases is limited to 200.
2-8 Database 2-8-1 Trend Data This function extracts data form OVNPM Trend database on the selected node. Viewing Trend Data Step 1: Click on the DataBase menu option on the Navigator window. This displays the corresponding page. Figure 2-43 Navigator Database Page Step 2: Click on the Trend Data link. This displays the Trend Data page. Figure 2-44 Navigator Trend Data Page Step 3: To request information, enter the parameter values associated with the selected link. 1.
This returns the requested information. Trend data extraction uses three stages in tree HTML frames: • Trend domain and node selection • Metric and instance selection • Time selection and data extraction Trend domain and node selection In the first stage, domain of query is selected. If navigator is a distributed server, node could also be selected. The Submit button will load or reload the second frame with instance (unit) and metric (counter) of selected domain.
2-9 Help Navigator comes with online help, which can be accessed by clicking the Help link on the Navigator window. This displays the Help page. Figure 2-46 Navigator Help Page Click on any of the link for which you are looking for help. This will return the requested information.
2-10 Admin 2-10-1 Password This function can only be accessed by, the Navigator Administrator (ADMIN logon). This option allows modifying the passwords for different Navigator users. A password must have between 4 and 13 characters and all characters must be in uppercase. You can modify the password of all Users. Step 1: Click on the ADMIN link on the Navigator window to display the Administration page. Working with Navigator Figure 2-47 Navigator Admin Page Step 2: Click on the Password link.
Step 3: To change password, enter the parameter values associated with the selected link. 1. Select the profile using the Profile field. 2. Enter the new password in the New Password field. 3. Enter the new password again in the Confirm New Password field to confirm the new password. 4. Click on the Submit button. This will change the requested password. NOTE: The password must have at least 4 characters and less than 13 characters.All characters must be uppercase characters.
2-10-2 Profile This function can only be accessed by the Navigator Administrator (ADMIN logon). This option allows modifying information from the following user profiles: 1. ADMIN 2. OPERATOR 3. APPLI 4. DEV 5. SUPPORT 6. GUEST 7. ANONYMOUS A profile specifies which Web pages a User can display, and the frequency at which the Navigator updates these pages The administrator can enable, disable or modify the default properties of this function.
This will display the Profile Modify Fields page. Figure 2-50 Navigator Modify Profile Page Step 4: To modify profiles, enter the parameter values associated with the selected link. 1. Make the changes in the different fields available. 2. Click on the Update Profile button. This will make all the changes and display the Modify Profile Result page. Figure 2-51 Navigator Profile Results The profile is saved on the HP NonStop server in the file [ovnpm^vsv^cfg].PROFILE.
2-11 About The About link provides general information about the product along with the HP NonStop nodes configured.
2-12 Switch Menu Navigator allows the user to expand and collapse the navigation pane. You can expand the navigation options by clicking on the Switch Menu option. This will show the submenus available for different menus in the navigation pane.
Index A About link, 64 Activity, 8, 33 AppliDef Metrics, 17 Availability, 8, 18 File Scan, 31 G Process Transition, 45 Profile, 62 Program Metrics, 17 Group Metrics, 16 S H C help, 59 Spooler Status, 26 status, 18 Switch Menu, 65 CPU Metrics, 15 Cpu-Busy.%, 34 I T Icons & Hyperlinks, 9 Top Dashboard link.
Document Feedback Form We would appreciate your comments on the OVNPM Navigator Guide. After you have read the Guide and used the software, please take a few moments to complete this form and return it to appropriate HP product support service. Guide 1. The organization of the Guide makes it easy to locate topics quickly. Strongly Disagree 1 2. Strongly Agree 2 3 4 The appearance of the pages makes it easy to locate information quickly. Strongly Disagree 1 3.
9. The level of writing in this book is: Too Basic Just Right Too Technical (Please be specific.) Do you have any other suggestions for improvement? Document Feedback Form 10.