
OVNPM 1.5.2 - Performance Agent for NonStop Navigation Guide

14
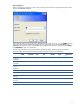
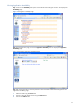
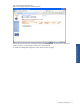
The following example shows selecting both cpu and disc domains for a NonStop Server. Only objects with cpu
busy %>=0.1 sec ( 100 msec) are displayed.
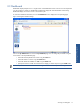
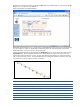
Figure 2-3 Navigator Top Dashboard Results
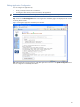
Dashboards display multiple views in a single window. Each dashboard contains a set of views and reports that
you can manage as a single unit. Dashboards simultaneously display the individual elements. Alternatively,
dashboards display views one at a time in an automatic cycle.
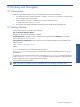
Clicking on the Dashboard menu option displays the Dashboard page. You can list the busiest entities using the
Top Dashboard link. The Top Dashboard enables you to display the top ten entities in the same window for
domains that contain the Cpu-Busy.% metric. The units associated with each domain are sorted in descending
order using the Cpu-Busy.% metric. The Top Dashboard function investigates the following domains: CPU, Disk,
Line, Netline, User, Group, AppliDef, Process, and Program.
CPU Metrics
Metric Description
cpu busy % Percentage of time that the CPU was busy during the sample time.
mem free% Percentage of Memory on the CPU that is available for use by applications
mem swp/s Number of Memory swaps per second during the sample time on the CPU.
cpu qln Average number of current processes that are ready to execute.
disc io/s Number of Disc I/Os per second for this processor (CPU).
low pcb Number of current Processes with Low-Pin on the CPU (snapshot).
high pcb Number of current Processes with High-Pin on the CPU (snapshot)