
OVNPM 1.5.2 - Performance Agent for NonStop Server Monitoring Guide


32
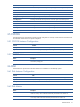
Metric
Description
Audit-Buf-Force-4096.nb
Number of times that the disk process had to write to the audit trail volume before it
could write a dirty 4096 cache block and thereby free that block for another use.
Audit-Buf-Force-512.nb Number of times that the disk process had to write to the audit trail volume before it
could write a dirty 512 cache block and thereby free that block for another use
Avrg-Cache-Hits.%
Average of the metric Cache-512-Hits.%, Cache-1024-Hits.%, Cache-2048-Hits.% and
Cache-4096-Hits.%
Busy.MB
Number of megabytes currently in use on the specified disc.
Cache-1024-Hits.%
Percentage of disc requests satisfied from 1024 byte block Cache
Cache-2048-Hits.%
Percentage of disc requests satisfied from 2048 byte block Cache.
Cache-4096-Hits.%
Percentage of disc requests satisfied from 4096 byte block Cache.
Cache-512-Hits.%
Percentage of disc requests satisfied from 512 byte block Cache
Cpu-Busy.%
Percentage of CPU time used by the Disk Processes for the current disk.
Disc-Space-Busy.%
Percentage of disk space busy
Device-QBusy.%
Time spent in a state in which requests of any number or type were queued to this disk in
this processor [Meas]. This counter is built on Measure Disc.Device-Qbusy-time counter.
Frag-Largest.MB Megabytes of the largest free space fragment on the disk.
.Fragments.nb
The number of individual free space fragments on the disk.
Free.MB
Megabytes of disc space available on the specified disc.
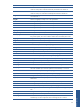
IO.nb/s
Number of I/Os per second during the sampling period.
IO-Busy.%
Percentage of time that the disc was being used during the sample time.
IO-Len.B
Average size of I/Os during the sample time.
IO-Long-Time.ms Average duration of an I/O operation.
IO-Rate.Kb/s
Total number of kilobytes written and read during the sampling period.
Read.nb/s
Number of read operation per second during the sampling period.
Read-Busy.%
Percentage of time the disc was being used for read operation during the sample time.
Read-Len.B
Average size of read operation during the sample time.
Read-Long-Time.ms
Average duration of a read operation.
Read-Qlong-Time.ms This metric available only on G-Series replaces the metric Read-Long-Time.ms on D-Series
Read-Qbusy.%
Percentage of time spent by read requests queued to the disk.
This metric available only on G-Series replaces the metric Read-Busy.% on D-Series
Read-Rate.Kb/s Total number of kilobytes read during the sampling period.
Request.nb/s
Number of request operations per second during the sampling period.
Request-QLen.nb
Average number of request on disk process internal queue.
Request-Qlen-Max.nb
Maximum number of read requests queued to this disk [meas]. This counter is built on the
Measure Disc.
Request-QTime.%
Percentage of time that requests spent on the disk process internal queue.
Sum-Cache-Hits.%
Percentage of requests to Disc Cache that were satisfied from cache rather than disc.
Write.nb/s
Number of write operations per second during the sampling period.
Write-Busy.%
Percentage of time that the disc was being used for write operations during the sample
time.
Write-Len.B Average size of write operation during the sample time.
Write-Long-Time.ms
Average duration of a write operation.
Write-Qlong-Time.ms Time in which write requests of any number were queued to the disk. This metric
available only on G-Series replaces the metric Write-Long-Time.ms on D-Series
VNPM Entities