
OVNPM 1.5.2 - Performance Agent for NonStop Server Monitoring Guide


36
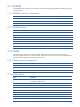
Metric
Description
Disc-Ext-Warn.nb
Number of times that the size of the next allocated extent (primary or secondary extent)
of the file is larger than the largest extent size of the disk.
• For a single file
This number can be equal to 0 or 1 (0 means the file will not have a problem for the
next extent allocation, 1 means that the next extent allocation will fail)
• For a partitioned file
This number may be greater than 1 due to multiple secondary partitions.
Consideration
: If the file has no allocated extents, the next allocated extent is the primary
extent. If the file has at least 1 extent allocated, the next allocated extent is a secondary
extent.
Eof.KB
Size in KB of the file.
Free -Extent.nb
Number of available extents of a file.
Full.%
Percentage Full of the file.
3-9 GROUP
The GROUP domain represents the activity of processes executed from a particular group logon. The process-
activity is summarized from a group (account) point of view.
3-9-1 GROUP Instance Configuration
Domain
GROUP
DescriptionDomain
GROUP represents the activity of processes executed from a particular group logon.
Syntax
GROUP <GroupNumber> <GroupName> [,TREND=<ON|OFF>]
Example
GROUP 255 SUPER
3-9-2 GROUP Metrics
Metric
Description
Activ-Process.nb
Number of processes with this group-Id that had CPU activity during the sample period.
Cpu-Busy.%
Percentage of time that processes with this group-Id were executing in this node.
Mem-Page.nb
Number of memory pages that have been swapped in by the processes belonging to the
group and are still resident.
Msg-Rcvd.nb
Number of messages received by processes belonging to the group.
Msg-Sent.nb
Number of messages sent by processes belonging to the group.
Page-Fault.nb
Number of page-faults for processes belonging to the group.
Process.nb
Actual number of processes that were executing with this group-Id during the sample
period. This includes both active and inactive processes.
Rcvd-QLen.nb Total number of messages currently on the processes receive queue belonging to the
group.
Sum-Cpu-Busy.%
Cpu-busy sum of all the processes belonging to a group. It can be higher than 100%. It’s
always less than or equal to 100%*cpu-nb. That metric can be compared only with
processes and disc, line and netline cpu-busy.
Warning:
Navigator displays the Group.Sum-Cpu-Busy but it uses the label “Cpu-Busy”.
Cpu-busy.%
Sum-Cpu-Busy.% divided by the number of CPUs. Cpu-Busy% is always less than or
equal to 100%. Cpu-Busy.% is just an indication, and can be compared only with
NODE.cpu-busy %.