
OVNPM 1.5.2 - Performance Agent for NonStop Server Monitoring Guide


OVNPM Entities 39
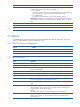
Metric
Description
Avrg-Disc-Service-Time.%
Percentage of average disc service time (Disc-Busy).
Avrg-Line-IO-Rate.Kb/s
Average number of Kilobytes per second exchanged on a line.
Avrg-NLine-IO-Rate.Kb/s
Average number of Kilobytes per second exchanged on a Netline.
Avrg-Process-Load
Average CPU-Load of an active process.
Comp-Trap.nb/s
Number of times a compatibility trap occurred on all CPUs for the node during the time
interval, presented as a single count.
Cpu-Busy.% Percentage of average combined CPU-Busy for all CPUs in the node, presented as a
single average.
CPU-Load
Average combined CPU-Load for all CPUs in the node, presented as a single average.
CPU-Wait.ms
Average time that a process waited to access the CPU during the interval.
Cspool-Full.%
Percentage of available space in the spooler collectors being used to store print jobs.
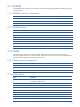
Disc-Busy.GB Gigabytes of disc space currently allocated on this system.
Disc-CPU-Busy.%
Percentage of CPU-Busy used by DISC PROCESSES for all CPUs in the node.
Disc-Free.GB
Gigabytes of disc space not currently allocated on the system.
Disc-IO.nb/s
Total Disc-IO for the system, measured in number of bytes per second.
Disc-Space-Busy.%
Percentage of disc space currently allocated on this system.
High-Pcb-Curr.nb
Number of current processes with High-Pin (snapshot).
Highest-CPU-Busy.% Highest percentage of busy CPU on the system.
Highest-Memory-Free.%
Highest percentage of free memory on the system.
Intr-Busy.%
Percentage of time that CPU spent executing Interrupt handlers.
Line-CPU-Busy.%
Percentage of Combined CPU-Busy used by LINE HANDLERS for all CPUs in the node.
Line-IO.nb/s
Number of I/O per second during the interval for all configured lines.
Low-Pcb-Curr.nb
Number of current processes with Low-Pin (snapshot).
Lowest-CPU-Busy.% Lowest percentage of busy CPU on the system.
Lowest-Memory-Free.%
Lowest percentage of free memory on the system.
Memory-Free.%
Percentage of total memory in the system that is available for use by applications.
Memory-Swap.nb/s
Number of Memory swaps per second for all CPUs during the interval.
Memory-Wait.us
Average time that a process waited to access Memory.
Netline-Cpu-Busy.
Percentage of Combined CPU-Busy used by NETLINE HANDLERS for all CPUs in the
node.
Netline-IO.nb/s
Number of I/O per second during the interval for all configured netlines.
Send-Busy.%
Percentage of Combined CPU-Busy used to send data from a CPU to another CPU for
all CPUs in the node, presented as a single measurement.
Tns-Busy.% Percentage of Combined Tns-CPU-Busy for all CPUs in the node, presented as a single
measurement.
Tnsr-Busy.%
Percentage of Combined Tnsr-CPU-Busy for all CPUs in the node, presented as a single
measurement.
Trans-Live-Time.s
Average life of a TMF transaction in the system, measured in seconds.
Trans-Total.tps
Number of TMF transactions being handled by the system per second.
OVNPM Entities