
OVNPM 1.5.2 - Performance Agent for NonStop Server Monitoring Guide

Appendix A 67
Appendix A
OVNPM Metrics
This section describes the various OVNPM metrics like SystemInsight, SystemTrend, SystemReport, SystemCloseup
and SystemAccounting and the associated domains.
Metrics
OVNPM provides real-time monitoring and trend information on a number of HP NonStop system components.
Data counters used to store the information for the components are called Metrics.
Domains
The metrics for the system are concatenated into a logical group called a Domain. Domains may contain other
domains (sub-domains), metrics, or both.
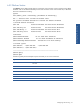
SystemReport Metrics
Domain CPU
CPU reports can have a maximum of 20 lines containing processes that use the most CPU Time. Each process
uses approximately “n%” of CPU-Busy, where “n” is the actual value of the ReportAccuracy parameter in the
DCPRM file. Each line describes features of one process.
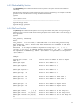
Metric
Description
%Cpu Busy
Percentage of time the Process was executing in the CPU.
%Cpu Dist
Percentage of CPU-Busy-Time used by the Process.
Grp, Usr
Owner of the current process.
HomeTerm
Full name of the HomeTerm of the current process.
Mem-Page
Number of memory pages that have been swapped in by the process file.
Msg-Rcvd
Number of messages received by the process.
Msg-Sent
Number of messages sent by the process.
Page-fault
Number of page-faults for the process.
Pin.
Process identification number of the current process.
Pri
Executing priority of the current process.
Process Name
Process name or unit name of the current process
ProgFile
Full file name of program file of the current process.
Rcv-Qlen
Number of messages currently on the process receive queue.
Appendix A