
OVNPM 1.5.2 - Performance Agent for NonStop Server Monitoring Guide

68
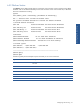
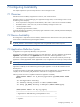
Domain NODE
Node view contains a maximum of 16 lines (one for each CPU). Each line describes features of one CPU and the
four processes that use the most CPU Time.
Metric
Description
%Cpu-Busy
Percentage of time the CPU was busy during the sample time.
1%Cpu-Pin-Pname-Usr-Pri Percentage of CPU Time, Pid, name, owner and priority of the Process using the most
CPU time
2%Cpu-Pin-Pname-Usr-Pri
Percentage of CPU time, Pid, name, owner and priority of the Process which use the
second most CPU Time
3%Cpu-Pin-Pname-Usr-Pri Percentage of
CPU Time, Pid, name, owner and priority of the Process that use the third
most CPU Time.
4%Cpu-Pin-Pname-Usr-Pri
Percentage of CPU Time, Pid, name, owner and priority of the Process that use the
fourth most of CPU Time.
CPU
CPU number
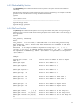
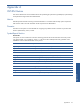
SystemCloseup Metrics
SystemCloseup supplies metrics on 4 domains:
• CPU
• PROCESS
• FILE
• DISC
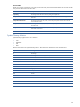
Measure units follow most SystemCloseup metrics. These extensions describe the metric characteristics.
Symbol
Meaning
%
Percentage
%%
Percentage with a scale 10 (1 / 1000)
# or nb
Number of items
nbs or nb.s or /s
Number per second
Kbs or Kb/s
Kbits per second
b
bits
B
Bytes
MB
Megabytes
KB
Kilobytes
mn
minutes
s
seconds
ms
milliseconds
x10
scale = 10
x100
scale = 100