
OVNPM 1.5.2 - Performance Data Analyzer User and Installation Guide


Data Analyzer Interface 34
4 Data Analyzer Interface
4-1 Overview
Seeing and interacting with data are the two factors essential for understanding the answers hidden in them.
Imagine being able to marry your data, for example, transaction data, device state data, CPU busy, network
busy and disk busy statistical information to determine exactly what caused a problem at 3:12 PM on Tuesday.
You will no longer need to guess what caused performance problems on your network. You can do root-cause
analysis and take immediate corrective action to fix the condition. Data Analyzer provides you the confidence
that the information you are viewing will help your organization achieve performance excellence. It allows you
to dynamically create graph, chart and grid “Dashlets” for meaningful displays of your most important data
assets. problem
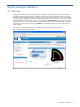
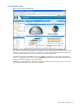
This in topic, we would learn about the various elements of the Data Analyzer web application.
Figure 4-1 Data Analyzer Web Interface