
OVNPM 1.5.2 - Performance Data Analyzer User and Installation Guide
Working with Dashboards 42
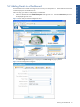
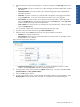
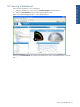
3. Panel Config Options
The Panel Config tab is the first tab available in the Panel Configuration dialog box. Enter the following
configuration information in the Panel Config tab page.
• Panel title: Displays the name of the Panel as specified during creation of the panel.
• Host name (filter): This field can be used to filter the transactions from the specified Host.
• Time offset (minutes): This field can be used to specify the time offset in minutes.
• Panel Type: Select the display type for the panel. The options available are Chart, Grid, Gauge,
Indicators and Web Page. The other tabs displayed in the Panel Configuration dialog box depends on
the panel type selected.
• Refresh Interval: Select the data refresh interval.
• Linking options: This field enables Inherit host name and/or Inherit date/time.
• URL: This option is displayed when Web Page is selected as the Panel Type. Specify the URL to be
displayed.
• Panel description: Specify a brief description for the panel.
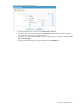
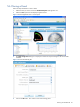
4. Chart Config Tab Page
The Chart Config tab page is displayed when you select the Panel Type as Chart in the Panel Config tab
page.
• Chart Type: Select the chart type from the drop-down list. The options available are Line, Spline,
Stepline, Pie, Doughnut, Column, Stacked Column, Stacked Column100, Bar
, Stacked Bar, Stacked
Bar100 and Point.
• Series name: Select the series name using the corresponding drop-down list. The options available are:
Add counter name and Entity name only.
• Legend position: Select the position where the legend will be displayed on the chart. The options
available are Inside, Outside – top, Outside – bottom, Outside – right and No Legend.
• Number of intervals: Select the number of intervals from the drop-down list.
• X-Axis margin: Select the text to be displayed on the X-Axis margin.
• X-Axis format: Select the display format of X-Axis. The options available are Auto, HH:mm, HH:mm:ss,
MMM, MMM d, MMM d HH:mm, MMM yyyy, MMM d yyyy.
• Y-Axis 1,2 titles: Select the titles you want to display for Y-Axis 1 and 2.
• Other options: Use the various options available in the drop-down box to Render in 3D, Add
scalebreaks and/or Print date/time in title.
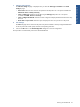
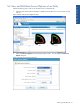
5. Data Options Tab Page
The Data Options tab page is displayed when you select the Panel Type as Chart in the Panel Config tab
page.
• Y-Axis 1,2 data types: Select the type of data you want to display for Y-Axis 1 and 2. The options
available are Default, Percent and Currency.
• Y-Axis 1,2 digits after decimal: Select the number of digits to be displayed after the decimal from the
drop-down list for Y-Axis 1 and 2.
• Y-Axis 1,2 max value: Enter the maximum value for the Y axis to be displayed on the chart.
• Marker 1 value and label: Enter the value and label for the first marker.
• Marker 2 value and label: Enter the value and label for the second marker.
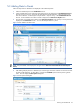
6. Gauge Config Tab Page
The Gauge Config tab page is displayed when you select the Panel Type as Gauge in the Panel Config tab
page.
• Gauge Type: Select the gauge type using the corresponding drop-down list. The options available are
Default, Semi-circular, Circular and Quarter-Circular.
• Series name: Select the series name for the panel from the drop-down list. The options available are:
Add counter name and Entity name only.
• Minimum Value: Enter the minimum value to be displayed on the gauge.
• Maximum Value: Enter the maximum value to be displayed.
• Show Indicator: Select whether you want to display the indicator.
• Show Range: Select whether you want to display the range in the gauge.