
OVNPM 1.5.2 - Performance Data Analyzer User and Installation Guide

Working with Dashboards 44
5-3 Adding Data to Panels
Follow the steps below to add data to be displayed in the Dashboard panels.
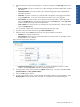
1. Select the Dashboard panel in the Dashboards Browser.
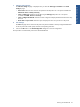
2. All the available data sources configured with Data Analyzer are displayed in the Available Data Sources
Browser panel in a tree-view, along with the data elements and the timeframes. Select the Data Source –
Data Source Element – Timeframe, (for example ATMTA – Acquirer- Daily ) in the Available Data Sources
Browser. Data available for the selection made is displayed in the Data Source Explorer area.
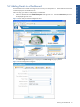
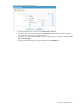
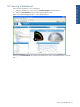
3. Drag the entity to be added to the panel from the Data Source Explorer area and drop it on the panel name
displayed in the Dashboards Browser. You can add multiple entities to a panel.
Figure 5-5 Data Added to the New Panel
NOTE: The panel added will be displayed in the given format Data Source Name.Data Source Element (Time
Frame).
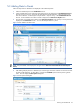
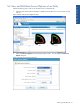
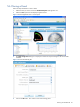
4. After adding multiple panels to a dashboard you need to apply some filter conditions on the basis of which
the data will be displayed. To add a filter to a panel select Add Filter option from the panel’s right-click
menu. This will display the Filter Options dialog box.
Figure 5-6 Filter Options Dialog Box