
OVNPM 1.5.2 - Performance Data Analyzer User and Installation Guide

Working with Dashboards 46
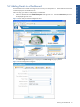
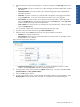
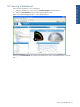
Figure 5-8 Filter Display Option Dialog box
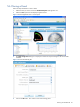
• Specify the threshold name and color using the Series name / color field.
• Select the type of chart to be displayed using the Chart Type drop-down field. The options available
are: Default, Line, Spline, Column, Stepline, and Point.
• Specify the value to be used for the Y-axis using the corresponding box. The options available are First
(left) and Second (right).
• Enter the threshold specifications using the various fields in the Thresholds area.