
OVNPM 1.5.2 - Performance Data Analyzer User and Installation Guide


Working with Dashboards 54
5-10 Dashboards Drill-Down Feature
Data Analyzer is a Web-based operational too that enables any user to create, monitor, analyze, and drill down
into any KPI across the enterprise. Vital KPI measurements can now be accessed and used without the
complexities associated with traditional data gathering, collaboration, and calculation.
Dashboards are the new face of information management. They enables operations to display data from any
system using an extensive choice of graphical KPI gauges; create required process KPIs from data residing in any
system; build comprehensive dashboards using visual elements (alert icons, traffic light, trends, progress bars,
and gauges); go from data to actionable KPI information without writing code; and eliminate the need for
spreadsheets by providing an engine that performs real-time calculations.
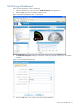
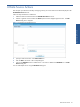
To drill-down, click on the area of the chart for which detail information is required. This displays a menu with
the following options:
• Analyze: Click on this option to displays the next level drill-down chart.
Figure 5-16 Data Analyzer Drill-Down Feature – Analyze
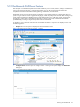
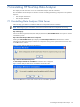
• Configure Actions: Use this option to configure actions. Clicking on the option displays the Edit Actions
dialog box.
Figure 5-17 Data Analyzer Drill-Down Feature – Analyze