
OVNPM 1.5.2 - Performance Data Analyzer User and Installation Guide


Working with Dashboards 55
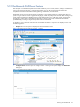
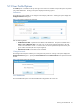
5-11 Dashboard Panel Icons
1. Edit Panel Options: The icon allows you to edit the Panel Configuration. You can select the
corresponding options to change the view of the graphical representation according to your requirements.
2. Refresh Panel: The
icon will refresh the data displayed.
3. Apply Filter Expression: The
icon will allow you to apply the filter condition on the data source column
names. Use
icon to remove the filter condition.
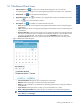
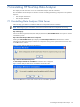
4. View Options: The icon enables you to perform the following tasks:
• Grid: Selecting this option will change the panel graphical representation into the corresponding grid
representation.
• Chart: Selecting this option will change the panel graphical representation into the corresponding chart
representation.
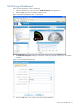
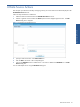
• Reposition Date/Time: This menu item will allow you to configure the data for any particular date and
time interval. Selecting this option will display the corresponding dialog box. Select the date of which
you want to visualize the data. Enter the time in the specified HH:MM:SS time format. Select the
Synchronize all panels check box to visualize the data for the same time interval in the other panels.
Figure 5-18 Reposition Panel Dialog Box
• Switch to Live Mode: Selecting this option will display the real-time data.
• Maximize: Selecting this option will maximize the panel representation
• Delete: This option will allow you to delete the corresponding panel from the list of panels available in
the dashboards.
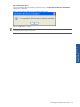
• Export to Excel: Selecting this option will allow you to export the data to an .xls file.
• Show / Hide expression filter: This option will allow you to either view or hide the filter expression.
NOTE: The Export to Excel and Show/Hide expression filter option will be available only when you
select Grid option as Panel Type.
Working with Dashboards