
OVNPM 1.5.2 - Performance Data Analyzer User and Installation Guide


Data Analyzer: Overview 6
1 Data Analyzer: Overview
This chapter lists the main features of Data Analyzer (DA) and highlights the advantages this software offers.
1-1 What is Data Analyzer?
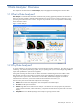
Data Analyzer is a best-of-breed web-based visualization tool providing graphical presentation of information. It
allows you to easily combine a multitude of data elements from various sources to create a unified view of your
processing environment that is like no other. The goal is to provide the viewer with a qualitative understanding
of the information content.
Figure 1-1 Data Analyzer
1-2 Why Data Analyzer?
To remain competitive, you must do more than just monitor business activities and objects. How often are you left
wondering: “Is my business performing to plan?” Are you spending most of your time searching through different
reports and spreadsheets to piece answers together?
Seeing and interacting with data are the two factors essential for understanding the answers hidden in them.
Data Analyzer provides you the insight you need to monitor and understand any impact that a problem or
outage can have on your business. The interactive visual models, dashboards and graphs can transform
information that is relevant to your business needs and what makes the most sense to you.
Here are a few points which make Data Analyzer best in the league.
Effective: The tool has been designed for ease of interpretation and data analysis.
Accurate: Provides precise evaluation.
Efficient: High data-ink ratio and minimum chart-junk. The data-ink ratio is the proportion of pixels that's
used to present actual data, without redundancy, compared to the total amount of pixels used in the entire
display.
Adaptable: The tool is flexible by-design and can adjust to growing business needs