
OVNPM 1.5.2 - Performance Data Analyzer User and Installation Guide


Data Analyzer: Overview 7
1-3 Features & Benefits
Unified Views
Data Analyzer allows you to easily combine a multitude of data elements from various sources to create a
unified view of your processing environment that is like no other.
Driving Performance Success
Data Analyzer helps drive performance success by representing your business using striking and
meaningful visuals in consolidated business-oriented views.
Taking Control
It is not uncommon for corporate departments to run thousands of reports that are of no use to decision
makers. There is a huge gap between reporting programs and expensive, high-end analytical products
which require statistics and/or programming expertise. Data Analyzer does not follow the usual prototype
of just displaying information. The Data Analyzer graphs and dashboards are not only interactive, they
help you understand the past; see the impact of previous decisions, and forecast the future. This
comprehensive Business knowledge allows you to respond quickly and effectively and take competitive
business decisions.
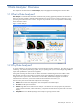
Connectivity to Major Data Sources
The Data Analyzer provides wrappers for most of the major databases. Just drag and drop your data and
start generating meaningful reports on your system. Simply select your data source, choose the elements
and timeframes you wish to view, and select the visual representation (Chart, Grid, Graph, etc.) and your
power-user dashlets are displayed. Thus, Business Managers and Analysts can now easily load data, do
analysis, and share results within minutes.
Business Intelligence Made Easy
Data Analyzer also frees Managers and IT Workers from the hassles of a traditional Business Intelligence
platform. There is no need to purchase an expensive platform. And if you have already invested, Data
Analyzer will enhance your existing business intelligence investment at a fraction of the cost.
Intuitive Interface
Interpreting Data Analyzer displays & graphics is easy for users, and provides greater depth of information
than traditional charts and graphs. You don’t have to view voluminous reports to find problems –
exceptions are automatically highlighted. The professional-grade images and graphics can be used in print
or slide presentations.
Dynamic Data & Drill-Down
Web-based Data Analyzer Dashboards are update automatically with no need to resynchronize or
repopulate. Charts and tables support drilldown to detailed data or other dashboard presentations.
More…
• Improve Corporate Branding
• Root-Cause Analysis
• Refine Business Model using Business Intelligence
• Data Visualization and Data Management
• Analyze Business Performance with Consolidated Snapshots
• Explorative Data Mining
• Real-Time Integration
• Predictive Analysis
• Visual and Interactive Data Exploration
Data Analyzer: Overview