HP Performance Monitor Users and Installation Guide Part number: 586623-002 Second edition: 03/2012
Legal notices Hewlett-Packard makes no warranty of any kind with regard to this manual, including, but not limited to, the implied warranties of merchantability and fitness for a particular purpose. Hewlett-Packard shall not be held liable for errors contained herein or direct, indirect, special, incidental or consequential damages in connection with the furnishing, performance, or use of this material.
Contents Preface Before You Begin ........................................................................................................................................ 4 Who Should Read This Guide ...................................................................................................................... 4 Goals of Documentation .............................................................................................................................. 4 Organization...........................
Preface Bottlenecks can virtually occur anywhere and on any element of the environment. It may be caused by the malfunctioning of resources, systems lacking enough resources or a program that dominates a particular resource. Performance Monitor helps in tracking these bottlenecks and allows you to take the appropriate proactive actions. Before You Begin Before reading the documentation, you are expected to have a basic understanding of the Windows Operating System, as well as the HP NonStop environment.
This chapter lists out the benefits of Performance Monitor and highlights the advantages this software offers. 1-1 What is HP Performance Monitor? The Performance Monitor (PM) tool delivers easy-to-use performance monitoring and tracking for the HP NonStop environment. Built to manage environments of all sizes, Performance Monitor scales with the rapid growth of your environment and expands with your monitoring needs.
1-3 Benefits Following are the benefits of Performance Monitor. • Increased Service Availability: It brings information critical to managing Service Level Agreements on the HP NonStop system. System availability and performance will be improved, as monitoring will highlight potential breaches in Service Level Agreements. • Enhanced Productivity: The consolidate view can be used to enhance the overall productivity of the business.
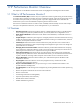
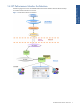
HP Performance Monitor: Overview 1-4 HP Performance Monitor Architecture The following figures show the consolidated Performance Monitor data flow between the HP NonStop environment and the Windows environment.
1-5 HP Performance Monitor Components From the architectural point of view, Performance Monitor architecture can be grouped into the following categories: • Components on the HP NonStop Host • Components on the Windows Workstation 1-5-1 HP Performance Monitor Components on the HP NonStop Server • Collect Manager: Basic Collectors collect the information from the Measure subsystem and send it to the Collect Manager. One Basic Collector is present per CPU.
PM Logger: This service is responsible for reading the Flat file database and logging the performance data in the SQL Database. The performance data includes predefined metrics related to domains like cpubusy%, FreeMemory, page-fault. • Summary Broker Service: This is a SQL Broker Service that calculates the statistics, for example, MIN, MAX, AVG, over samples of 5 minutes, one hour, daily, weekly, monthly, and yearly, for the performance data.
2 Installing HP Performance Monitor This chapter provides information on the steps to be followed for installing HP Performance Monitor on Windows environment. 2-1 Prerequisites 1. Before starting the installation, it is recommended that you exit from any other Windows programs that are running. 2. Microsoft SQL Server 2005 or above is a must to install Performance Monitor Database and Performance Monitor Application Server. 3. Microsoft .NET framework 2.
2-2 Installing HP Performance Monitor on Windows 2-2-1 Overview Installing Performance Monitor involves installing the following components in the same sequence. • Installing Performance Database using SQL Script: This involves installing the Performance Monitor database using SQL Script. • Performance Monitor Application Server: This involves installing the Performance Monitor Application Server.
• Password: Password for the selected SQL server. 4. Press the F5 key or click the Execute button to run the script. 5. Run the following script to check the version of the InsightCollectDB database. use insightcollectdb; select * from dbversion; 7. Once the PM Application Server is upgraded and the configuration is done, the static data is inserted in the database. • Execute the UpdateSummaryFlag.
Figure 2-3 Performance Monitor Application Server Setup License Agreement Page 4. Review the software license agreement and click the Yes button to continue with the installation. The Setup Type page is displayed. Figure 2-4 Performance Monitor Application Server Setup Type Page The Setup Type page prompts you to select the type of setup required. You can select from any of the two options. • Complete: This setup type provides full functionality of the software.
6. Select the location where the configuration files folder for PM Transport and PM Logger will be created. This folder should have write/file creation permissions for the user who uses the Configuration Client to modify configuration information. You can also browse for the cfg folder using the Browse button. 7. Click the Next button. The Choose Destination Location page is displayed.
9. Click the Next button. The Choose Destination Location page is displayed. Figure 2-7 Performance Monitor Application Server Setup Choose Destination Location Page 10. Select the location where Performance Monitor Data folder will be created. This folder should have write/file creation/deletion permissions to the user under whose credentials the PM Transport service is started. You can browse for the data folder using the Browse button. 11. Click the Next button. The SQL Server page is displayed.
14. Click the Next button. The Check Setup Information page is displayed. The current settings, which have been selected so far, are displayed. To change any of the settings, click the Back button to go the particular page. NOTE: You should check the location of the directory where Performance Monitor Application Server is to be installed. In case the location has to be changed after installation, you will have to reinstall the software. 15. Click the Next button to continue.
16. Enter the Configuration Name and IP Address /Host Name in the respective fields and click the Next button to continue. The Host Configuration page is displayed again. Figure 2-11 Performance Monitor Application Server Setup Host Configuration Page 17. Enter the HP NonStop Node Name and Port number in the corresponding fields and click the Next button to continue. The Performance Monitor Application Server message box is displayed. Figure 2-12 Performance Monitor Application Server Message Box 18.
The Performance Monitor Application Server Setup Completed page is displayed. 19. Installing HP Performance Monitor Figure 2-13 Performance Monitor Application Server Setup Completed Page Click the Finish button to complete the Setup process. The InsightCollectDB Database has the HOSTTIMEINFO table that contains information for the offsets of each HP NonStop node from UTC in minutes through different time ranges around the year taking into account the Daylight Savings Time information.
2-2-3 Upgrading Performance Monitor Application Server To upgrade Performance Monitor Application Server, perform the following steps. 1. Double-click the PerformanceMonitor_ApplicationServerInstallation.exe to start the upgrade process. The Performance Monitor Application Server message box is displayed. Figure 2-14 Performance Monitor Application Server Message Box 2. Click the OK button. The Performance Monitor Application Server Setup – InstallShield Wizard is displayed.
3. Click the Next button. The Choose Destination Location page is displayed. The default path where the configuration files are saved is displayed. Figure 2-16 Application Server Setup – Choose Destination Location Page (Configuration Files) 4. To save files at a location other than the default location, click the Browse button. 5. To continue with the setup, click the Next button. The default path where the log files are saved is displayed.
7. To continue with the setup, click the Next button. The default path where the data files are saved is displayed. Figure 2-18 Application Server Setup – Choose Destination Location Page (Data Files) 8. To save files at a location other than the default location, click the Browse button. 9. To continue with the setup, click the Next button. The InstallShield Wizard starts updating the Performance Monitor application server. The Application Server Setup – Setup Status page is displayed.
Once the Setup is complete, the Application Server Setup – Setup Complete page is displayed. Figure 2-20 Application Server Setup – Setup Complete Page 10. Click the Finish button, to complete the procedure.
3 Getting Started This chapter details the steps for starting and checking status of various Performance Monitor components. 3-1 Starting Performance Monitor on HP NonStop Server Performance Monitor uses the OVNPM NonStop components. For details on how to start and stop OVNPM Server components, refer to the OVNPM Server Management Guide.
3-3 Starting Performance Monitor Configuration Client To access the Performance Monitor Configuration Client, click All Programs HP OVNPM Performance Monitor Application Server Generic Configuration Client in the Windows Start menu.
3-4 Stopping Performance Monitor on Windows To access the Performance Monitor Configuration Client, click All Programs HP OVNPM Performance Monitor Application Server Stop Performance Monitor services in the Windows Start menu Figure 3-3 Stop Performance Monitor services Option 3-5 Stopping Performance Monitor on HP NonStop Server Getting Started Performance Monitor uses the OVNPM NonStop components. For details on how to stop OVNPM Server components, refer to the OVNPM Server Monitoring Guide.
4 Performance Monitor Configuration Client The Performance Monitor Configuration Client is an interface, which enables you to edit configuration settings of the Performance Monitor Application Server components.
4-1 Adding a New Configuration To add a new configuration, perform the following steps. 1. Select the New option from the Configuration drop-down menu in the Performance Monitor Configuration Client. The various configuration parameters are displayed along with the default values in the Performance Monitor dialog box. Figure 4-2 Configuration Parameters Enter the values in the respective configuration parameters and click the Save button to save the settings. This will add the new configuration.
4-2 Modifying an Existing Configuration To modify an existing configuration, perform the following steps. 1. Select a configuration from the Performance Monitor Configuration Client to be modified. 2. Click the Edit/View option from the Configuration drop-down menu. This displays the Current Settings dialog box. 3. Make the required configuration changes and click the Save button to save the modifications.
Configuration Parameter Description Default Value Report Data Collection Enabled Enables Report data Collection of performance data. It can take the following values: • True • False NOTE: It is NOT recommended to turn this off using the False value. False Data Recovery Enabled Decides whether to recover lost data or not in case the PM Logger service was not running for certain time duration.
4-5 Additional HP Performance Monitor Configuration Parameters The following Data retention parameters can be configured for each configuration added in. Configuration Parameter Description retention report ci Specifies the data retention period for Report Data files. The default value is 7 days. retention insight ci Specifies the data retention period for Insight Data files. The default value is 7 days.
5 Uninstalling HP Performance Monitor This chapter provides instructions on how to uninstall Performance Monitor from your computer. The uninstallation of Performance Monitor on Windows involves uninstalling the following components in the specified sequence: • Performance Monitor Application Server • Performance Monitor Database 5-1 Uninstalling HP Performance Monitor Application Server Follow the steps given below to uninstall the Performance Monitor Application Server components from the workstation.
Step D: Rebooting the System It is recommended to reboot the system for proper functioning. The Performance Monitor Application Server Uninstallation message box is displayed. Figure 5-3 Performance Monitor Application Server Uninstallation Message Box Click the OK button to continue. NOTE: Clicking the OK button does NOT reboot the system. It is recommended to reboot the system after uninstalling the Performance Monitor Application Server.
5-2 Uninstalling Performance Monitor Database Follow the steps given below to uninstall the Performance Monitor Database components from the workstation. Step A: Starting Up Click the Start\All Programs\HP OVNPM\Performance Monitor\Database\Uninstall Database menu option to start the uninstallation process.
6 HP Performance Monitor Database Schema This chapter provides an overview of Performance Monitor database schema, its various components and the relationship model. 6-1 Overview Database schema is the physical layout or the graphical depiction of the database structure. It shows the relationship between the various components of the database.
The Database schema consists of the following tables: • Configuration Tables • Metric Data Tables • Stat Data Tables 6-2-1 Configuration Tables PM Logger collects the HP NonStop configuration information using the Configuration files. These configuration parameters are used to connect to the database. The NonStop Server consists of certain predefined active entities like domains, metrices, and instances.
Table: Metric Map Column Name Data Type Description NodeId Integer Specifies the Node ID MetricId Integer Specifies the Metric ID NSKMetricId Integer Specifies the NSK Metric ID InsightFlag Bit Specifies whether the Insight Performance data will be collected or not TrendFlag Bit Specifies whether the Trend Performance data will be collected or not ReportFlag Bit Specifies whether the Report Performance data will be collected or not Column Name Data Type Description DomainID Integer
Column Name Data Type Description ConfigId Integer Specifies the Configuration ID TrendTableId Integer Specifies the ID of Trend type LastSummaryTix Integer Specifies Tix number upto which Last summarization is completed SummaryState Char(20) Specifies whether the summary is active or not SummaryStatus Char(20) Specifies whether the last summarization process was completed or not LastSummaryTime Integer Mentions the time stamp of the last summarization Table Trend Configuration Column N
6-2-2 Metric Data Tables Metric data tables contain the metric counter data information. These tables include variable data that keeps on updating from the back end. PM Logger keeps on inserting the collected performance metric data into these tables. The column names in data tables are the metrics defined on the back end for a particular domain. Domain APPLIDEF The APPLIDEF domain represents a group of processes that define an application.
Data Type Description Avrg-Msg-Sent.nb float Average number of messages sent by one APPLIDEF process to other processes Avrg-Msg-Rcvd.nb float Average number of messages received by one APPLIDEF process to other processes Avrg-Ready-Time.% float Average percentage of time that one APPLIDEF process spent on the ready list or executing. Avrg-Mem-QTime.% float Average percentage of time that one APPLIDEF process was on the ready list and waiting on page fault. Avrg-Pres-PagesMax.
6-2-3 Stat Data Tables The Stat data tables contain the trend data information required for capacity planning and management reporting. The Service Broker keeps close look on the Insight Data tables and as soon as the Data collection for a particular summarization interval is completed it fires an event to its background summarization service. This starts the insertion of the calculated stats into the Stat Data tables. The following Stat tables are available in the database.
Document Feedback Form We would appreciate your comments on the HP Performance Monitor User and Installation Guide. After you have read the Guide and used the software, please take a few moments to complete this form and return it to appropriate HP product support service. The organization of the Guide makes it easy to locate topics quickly. Strongly Disagree 1 2. Strongly Agree 2 3 4 The appearance of the pages makes it easy to locate information quickly. Strongly Disagree 1 3.
9. The level of writing in this book is: Too Basic Just Right Too Technical (Please be specific.) 10.