
OVNPM 1.5.2 - Performance Monitor User and Installation Guide


HP Performance Monitor: Overview 9
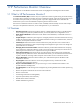
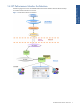
• PM Logger: This service is responsible for reading the Flat file database and logging the performance data
in the SQL Database. The performance data includes predefined metrics related to domains like cpubusy%,
FreeMemory, page-fault.
• Summary Broker Service: This is a SQL Broker Service that calculates the statistics, for example, MIN, MAX,
AVG, over samples of 5 minutes, one hour, daily, weekly, monthly, and yearly, for the performance data.
PM Logger Service reads the summary detail parameters from the pmlogger.ini file and insert them into the
summarization configuration tables (database tables). These parameters are further used by Summary
broker service to summarize the performance data.
Summarized trend data over various intervals can be used for Trend Analysis and Capacity planning.
HP Performance Monitor:
Overview