PEEK Reference Manual Abstract This manual describes PEEK, a utility used to monitor the statistical data of processors in HP Integrity NonStop™ BladeSystems, HP Integrity NS-series systems, and HP NonStop S-series systems. It is intended for use by individuals responsible for operating, managing, and servicing NonStop systems. Product Version NA Supported Release Version Updates (RVUs) This publication supports J06.03 and all subsequent J-series RVUs, H06.03 and all subsequent H-series RVUs, and G06.
Document History Part Number Published 529657-001 June 2005 529657-002 November 2005 529657-003 May 2008 529657-004 February 2009 529657-005 May 2010 529657-006 August 2012
Legal Notices Copyright 2012 Hewlett-Packard Development Company L.P. Confidential computer software. Valid license from HP required for possession, use or copying. Consistent with FAR 12.211 and 12.212, Commercial Computer Software, Computer Software Documentation, and Technical Data for Commercial Items are licensed to the U.S. Government under vendor's standard commercial license. The information contained herein is subject to change without notice.
PEEK Reference Manual Glossary Index Figures Tables Legal Notices What’s New in This Manual v Manual Information v New and Changed Information v About This Manual ix Who Should Use This Manual ix Purpose of This Manual ix How This Manual Is Organized ix Related Reading ix Notation Conventions x 1.
2. PEEK Syntax and Examples (continued) Contents 2.
Tables (continued) Contents Tables (continued) Table 2-8. Table 2-9.
Contents PEEK Reference Manual — 529657-006 iv
What’s New in This Manual Manual Information PEEK Reference Manual Abstract This manual describes PEEK, a utility used to monitor the statistical data of processors in HP Integrity NonStop™ BladeSystems, HP Integrity NS-series systems, and HP NonStop S-series systems. It is intended for use by individuals responsible for operating, managing, and servicing NonStop systems. Product Version NA Supported Release Version Updates (RVUs) This publication supports J06.03 and all subsequent J-series RVUs, H06.
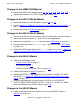
Changes to the 529657-005 Manual What’s New in This Manual Changes to the 529657-005 Manual Updated the PEEK POOL output on page 1-3, 2-6, 2-11, 2-19, 2-20, 2-41, 2-45. Updated the elements of the POOL Display table on page 2-42. Changes to the H06.17/J06.06 Manual Updated description of the CME option on pages 1-5 and 2-2. Updated Figure 2-4, PEEK ALL Listing (for H-series RVUs and J-series RVUs), on page 2-11. Updated information on CME Option on page 2-13. Changes to the H06.14/J06.
Changes to the H06.03 Manual What’s New in This Manual TOTAL ALLOCATED SEGMENTS HIGH ALLOCATED SEGMENTS TOTAL ALLOCATED PAGES HIGH ALLOCATED PAGES TOTAL FREE PAGES Added the output details under Examples after Report 2: on page 2-32. Added the output of the PEEK MQCINFO command on page 2-28. Added the output of the PEEK command in Figure 2-1 on page 2-5. Added the output of the PEEK ALL command in Figure 2-3 on page 2-8. Added the description of the NSAA Option on page 2-33.
Changes to the H06.
About This Manual This manual describes PEEK, a utility that reports statistical information maintained by the HP NonStop operating system. Who Should Use This Manual This manual is intended for those who manage and service NonStop systems. Because PEEK is designed to monitor statistical data about elements found within the operating system, this manual is most useful to those who manage a system or who perform performance analysis and tuning.
Notation Conventions About This Manual The System Generation Manual for G-Series RVUs for explanations of some entities that PEEK monitors, such as time-list elements (TLEs) The Measure Reference Manual and the Measure User's Guide for information about the Measure program, which provides more detailed information about a system’s activity and status The NonStop S-Series Operations Guide and NonStop NS-Series Operations Guide for operations instructions Notation Conventions General Syntax Notation
Notation for Messages About This Manual each side of the list, or horizontally, enclosed in a pair of brackets and separated by vertical lines. For example: LIGHTS [ ON ] [ OFF ] [ SMOOTH [ num ] ] K [ X | D ] address-1 … Ellipsis. An ellipsis immediately following a pair of brackets indicates that you can repeat the enclosed sequence of syntax items any number of times. For example: M address-1 [ , new-value ]... [ - ] {0|1|2|3|4|5|6|7|8|9}...
Change Bar Notation About This Manual Nonitalic text. Nonitalic letters, numbers, and punctuation indicate text that is displayed or returned exactly as shown. For example: Backup Up. % Percent Sign. A percent sign precedes a number that is not in decimal notation. The % notation precedes an octal number. The %B notation precedes a binary number. The %H notation precedes a hexadecimal number.
1 Getting Started With PEEK What is PEEK? PEEK is a utility that reports the statistical information maintained by the operating system. You can use PEEK to monitor processor activity for system storage pools, paging activity, message information, send instructions, and interrupt conditions.
Running PEEK Getting Started With PEEK Running PEEK To obtain a PEEK report on a processor on your current system, enter: > PEEK This command results in the default PEEK display, which gives statistical data about three areas of a processor's activity: TIME, POOL, and PAGING statistics.
Running PEEK Getting Started With PEEK PEEK - T9050H02 - (01AUG12) - (11JUN12) - (AWS) SYSTEM \B2A (C)1981 TANDEM (C)2004-2008 HEWLETT-PACKARD DEVELOPMENT COMPANY, L.P. SYSTEM 23 MAR 2010, TIME: 6:48___ELAPSD 1:25:19___CPU PROCESSBUSY TIME TLE 0:13:50.450 CURRENT USAGE 16 PCB 9: NRL 8: IDLE TIME 0.14% # CONFIGURED 15 47 3(NSE-D/NS14000) INTERRUPT TIME 35:55:17.854 22.15% MAXIMUM USED \B2A 125:56:56.940 # OF FAILURES 20000 47 255: 77.
Monitoring Another System Getting Started With PEEK FAULTS ALLOCS 11983 739987 6741 29 185 104 2.34 144.54 1.31 0.00 0.03 0.02 REDHIT REDBUSY REDTASK 0 0 0 0.00 0.00 0.00 TOTAL (per sec) TOTAL (per sec) CLEANQ: 0 FULLS FRLST:HITS 0 739234 DISKREADS DISKWRITES CLOCK:CALLS 753 FAILS 0 MUTEXCRAX NONMUTEXCRAX CYCLES 1.02 ALIASES: 0 FAILS 0 Note. PEEK examines the internal data structures of the operating system.
Using RUN Options Getting Started With PEEK Table 1-1. PEEK Options Option Function ALL Displays the information produced by all of the PEEK options. CME Displays relevant information related to correctable memory errors (CMEs) that have occurred since the processor was last loaded. delay Is the amount of time, in seconds, that you want PEEK to pause between samples. The range is 0 through 999. delay must be used together with samples and must appear after samples.
Specifying a Processor With the CPU Option Getting Started With PEEK Specifying a Processor With the CPU Option Unless you specify a processor, PEEK normally reports on the processor in your system that is running the TACL command interpreter or on a processor chosen by $CMON. However, you can select a different processor by using the CPU option of the RUN command. For example: > PEEK / CPU 2 / This command returns the TIME, POOL, and PAGING statistics for processor 2 on your current system.
Combining RUN Options Getting Started With PEEK 2. To use a PEEK option, enter it after the PEEK command at your TACL prompt. For example: > PEEK TIME 3. You can enter multiple PEEK options in any order on a single command line, but you must separate them from each other with either spaces or commas. For example: > PEEK TIME, CME, MESSAGES 4.
Combining RUN Options Getting Started With PEEK PEEK Reference Manual — 529657-006 1-8
2 PEEK Syntax and Examples This section contains the following: Syntax to run PEEK with brief descriptions of each of the PEEK options Default listing formats for PEEK Detailed information about each of the PEEK options with illustrations and examples Note. Because of width constraints, some examples in this manual might not be aligned exactly as the PEEK output is. Syntax to Run PEEK The syntax of the command to run PEEK is: [ \node. ] PEEK [/ run-options /] [ option ] [ ,option ] ...
Syntax to Run PEEK PEEK Syntax and Examples OUT option if you want to send PEEK output to a file or location other than your home terminal. option is one or more of these PEEK options. Separate the options from each other with either a space or a comma. Each option is described in greater detail later in this section. If you do not enter any options, the PEEK default listing format displays information for the TIME, POOL, and PAGING options.
Syntax to Run PEEK PEEK Syntax and Examples D[YNAMIC] must be used in combination with samples. The first sample displays information about a processor’s activity since the processor was loaded. If you specify DYNAMIC, successive samples display only the activity that occurs during each sample interval. Specify DYNAMIC instead of INIT when you want to monitor processor activity for a relatively short time period (15 minutes or less).
Syntax to Run PEEK PEEK Syntax and Examples NS[AA] displays voluntary rendezvous opportunities (VRO) and inappropriate I/O buffer access counters and reintegration status. For more information, see NSAA Option on page 2-33. PA[GING] displays paging statistics. For more information, see PAGING Option on page 2-35. PO[OL] displays pool-management statistics. For more information, see POOL Option on page 2-40. TIME displays the amount of time the processor has spent on processes, interrupts, and idle time.
PEEK Default Listing Format PEEK Syntax and Examples PEEK Default Listing Format When you specify PEEK with no options, a report is produced that is equivalent to the reports displayed by the TIME, POOL, and PAGING options. Figure 2-1 on page 2-5 shows an example of the default PEEK display for systems running G-series RVUs. Figure 2-1.
PEEK Default Listing Format PEEK Syntax and Examples Figure 2-2 shows an example of the PEEK default for H-series RVUs and J-series. Figure 2-2. PEEK Default Listing (for J-series RVUs and H-series RVUs) Banner PEEK ‐ T9050H02 ‐ (01AUG12) ‐ (13JUL12) ‐ (AWS) SYSTEM \PELICAN (C)1981 TANDEM (C)2004‐2008 HEWLETT‐PACKARD DEVELOPMENT COMPANY, L.P. 24 JUL 2012, 10:51___ELAPSD Time POOL TIME: TLE PCB NRL PTLE PME SHM SEM PROCESSBUSY TIME 1:48:42.441 1.80% INTERRUPT TIME 0:07:41.886 0.
Listing Headers PEEK Syntax and Examples Listing Headers The PEEK default listing headers are explained in Table 2-1. The elements reported in the TIME, POOL, and PAGING headers are explained in detail later in this section. Table 2-1. PEEK Default Listing Headers Header Explanation Banner PEEK product version, the system on which the report is being run, and copyright information. Date Date and time this display began.
ALL Option PEEK Syntax and Examples Figure 2-3. PEEK ALL Listing (for G-series RVUs) (page 1 of 2) Banner PEEK ‐ T9050G09 ‐ (05APR10) ‐ (30MAR10) ‐ (AUM) SYSTEM \SIERRA COPYRIGHT TANDEM COMPUTERS INCORPORATED 1981, 1985, 1988, 1990 SYSTEM \SIERRA 26 JUL 2012, 10:44___ELAPSD18303:26:33___CPU 1(NSR‐Z) Time POOL TIME: PROCESSBUSY TIME INTERRUPT TIME IDLE TIME 1605:28:44.028 8.77% 212:49:26.769 1.16% 16485:08:23.073 90.
ALL Option PEEK Syntax and Examples Figure 2-3.
ALL Option PEEK Syntax and Examples MESSAGES MQCINFO DISPATCHES INTERRUPTS VRO INAPPACC NSAA CME Example This example displays all PEEK statistics for processor 0: > PEEK / CPU 0 / ALL Figure 2-4 shows the results of this command for an NSE-D processor.
ALL Option PEEK Syntax and Examples When you enter the command PEEK /CPU 0/ ALL on a system running H-series or J-series RVU, an output similar to this example is generated: Figure 2-4. PEEK ALL Listing (for H-series RVUs and J-series RVUs) (page 1 of 3) Banner PEEK ‐ T9050H02 ‐ (01AUG12) ‐ (13JUL12) ‐ (AWS) SYSTEM \PELICAN (C)1981 TANDEM (C)2004‐2008 HEWLETT‐PACKARD DEVELOPMENT COMPANY, L.P.
ALL Option PEEK Syntax and Examples Figure 2-4.
CME Option PEEK Syntax and Examples Figure 2-4. PEEK ALL Listing (for H-series RVUs and J-series RVUs) (page 3 of 3) REINTEGRATION STATUS: NSAA NO CURRENT OPERATION BLADE A: CPU 0 CPU 1 CPU 2 CPU 3 SUCCESSREINT 0 0 0 0 LASTSUCCREINTTIME 0:00:00.000 0:00:00.000 0:00:00.000 0:00:00.000 BLADE B: CPU 0 CPU 1 CPU 2 CPU 3 SUCCESSREINT 0 0 0 0 LASTSUCCREINTTIME 0:00:00.000 0:00:00.000 0:00:00.000 0:00:00.000 BLADE C: CPU 0 CPU 1 CPU 2 CPU 3 SUCCESSREINT 0 0 0 0 LASTSUCCREINTTIME 0:00:00.000 0:00:00.
CME Option - H06.16/J06.05 and later RVUs PEEK Syntax and Examples CME Option - H06.16/J06.05 and later RVUs The CME option displays relevant information related to correctable memory errors (CMEs) that have occurred since the processor was last loaded. The occurrence of CMEs is considered normal with the high-density memory technology used in Integrity NonStop servers and in HP Neoview platforms. CMEs are handled automatically. No EMS event is logged in response to a CME.
CME Option - For releases before H06.16/J06.05 RVU PEEK Syntax and Examples When you enter PEEK CME, an output similar to this example is generated: > PEEK CME PEEK - T9050G09 - (05AUG02) SYSTEM \VIOLET COPYRIGHT TANDEM COMPUTERS INCORPORATED 1981, 1985, 1988, 1990 22 FEB 2004 , 10:52___ELAPSD SYSTEM \VIOLET 158:42:43___CPU 3(NSR-T) TOTAL CME ERRORS: 0 HARD CME PAGES: NONE SOFT CME PAGES: NONE Elements of the CME Display Table 2-2.
DYNAMIC Option PEEK Syntax and Examples Example This example displays CME information for processor 2: > PEEK / CPU 2 / CME PEEK - T9050G09 - (05AUG02) SYSTEM \VIOLET COPYRIGHT TANDEM COMPUTERS INCORPORATED 1981, 1985, 1988, 1990 22 FEB 2004, 14:44___ELAPSD TOTAL CME ERRORS: SYSTEM \VIOLET 132:18:54___CPU 2(NSR-T) 560 HARD CME PAGES: 7 6452 6444 6442 6451 6441 6450 6440 6449 6439 6447 6437 6446 6436 6445 6435 SOFT CME PAGES: NONE DYNAMIC Option Use the DYNAMIC option in combination with samples,
DYNAMIC Option PEEK Syntax and Examples PEEK - T9050G09 - (05AUG02) SYSTEM \VIOLET Report 1: COPYRIGHT TANDEM COMPUTERS INCORPORATED 1981, 1985, 1988, 1990 SYSTEM \VIOLET 22 FEB 2004 , 13:33___ELAPSD 161:24:17___CPU PAGES: PHYSCL (4Kb) 32767 LOCKED FAULTS CREATES READS WRITES 4429/28585 1960066 1748555 1130222 8671 (per sec) 3.37 3.00 1.94 0.01 CLOCK:CALLS CYCLES(per sec) SCANS/CALL FAILS 2158836 95.21( 0.000 ) 1.
HELP Option PEEK Syntax and Examples HELP Option The HELP option displays a syntax summary of all PEEK options.
INIT Option (Super Group Only) PEEK Syntax and Examples Example This example resets POOL maximums for processor 3: > PEEK / CPU 3 / INIT PEEK - T9050H02 - (01AUG12) - (11JUN12) - (AWS) SYSTEM \B2A (C)1981 TANDEM (C)2004-2008 HEWLETT-PACKARD DEVELOPMENT COMPANY, L.P. SYSTEM \B2A 22 JUN 2012, TIME: TLE PCB NRL PTLE PME SHM SEM 14:00___ELAPSD 162:05:56___CPU PROCESSBUSY TIME 0:01:04.650 1.26% MAXIMUM USED 16 9: 47 459 1 2 1 1 MAX.
INIT Option (Super Group Only) PEEK Syntax and Examples When you enter the command PEEK /CPU 0/ INIT on a system running H06.20 and later H-series RVUs or J06.09 or later J-series RVUs, an output similar to this example is generated: PEEK - T9050H02 - (01AUG12) - (11JUN12) - (AWS) SYSTEM \B2A (C)1981 TANDEM (C)2004-2008 HEWLETT-PACKARD DEVELOPMENT COMPANY, L.P. SYSTEM \B2A 22 JUN 2012, TIME: 14:00___ELAPSD PROCESSBUSY TIME 35:55:17.854 22.
INTERRUPTS Option PEEK Syntax and Examples CLEANQ: 0 FULLS 0 FRLST:HITS 739234 CLOCK:CALLS 753 FAILS 0 CYCLES 1.02 ALIASES: 0 FAILS 0 Note. For a system running J06.06 or earlier J-series RVUs and H06.17 or earlier H-series RVUs, NRL is displayed as a four-line output with the small-index (S) and medium-index (M) entries for NRL and PPL on separate lines. This four-line output is compressed to a single line NRL output from J06.07/H06.18 series onwards. For a system running J06.
INTERRUPTS Option PEEK Syntax and Examples When you enter the command PEEK /CPU 0/ INT on a system running H-series or J-series RVU, an output similar to this example is generated: PEEK - T9050H02 - (01MAY05) - (31MAY05) SYSTEM \HALF3 (C)1981 TANDEM (C)2004 HEWLETT-PACKARD DEVELOPMENT COMPANY, L.P. 8 JUN 2005 , 12:40___ELAPSD DISPATCHES: NORMAL 9,453,491 0:09:57.
Elements of the INTERRUPTS Display PEEK Syntax and Examples Elements of the INTERRUPTS Display Table 2-3. INTERRUPTS Elements Reported in the INTERRUPTS Display (page 1 of 2) Element Description1 INTRPTS Header identifying the INTERRUPTS display. DISP Number of dispatcher interrupts. BUS Number of interprocessor communication (IPC) interrupts. HIIO Number of high-priority I/O interrupts. For systems running Gseries RVUs, it does not apply and always returns 0.
Elements of the INTERRUPTS Display PEEK Syntax and Examples Table 2-3. INTERRUPTS Elements Reported in the INTERRUPTS Display (page 2 of 2) Description1 Element OTHER IPS AND APS Number of dispatches for IPs and APs such as General Fault Handler (GFH), TimeList IP, Send Queued Messages AP, Signal Trap Monitor AP, and XRAY IP that do what was considered an Interrupt Handler before the H-series RVUs.
MESSAGES Option PEEK Syntax and Examples Example This example displays interrupt conditions for processor 3: > PEEK / CPU 3 / INTERRUPTS PEEK - T9050G09 - (05AUG02) SYSTEM \VIOLET COPYRIGHT TANDEM COMPUTERS INCORPORATED 1981, 1985, 1988, 1990 22 FEB 2004 , 13:53___ELAPSD INTRPTS: DISP 96,204,093 SCHANL 0 IFAIL 148 SYSTEM \VIOLET 161:43:49___CPU 3(NSR-T) BUS HIIO IIO 42,113,197 0 8,250,591 CME UCME MAB BKPT 0 0 49 10,964 STKOV ARITHOV SAMPLE 4 14 0 TIME 3,419,017 OSP PFAIL 0 0 FAULT 304 PON 0 MESSAGE
Elements of the MESSAGES Display PEEK Syntax and Examples Elements of the MESSAGES Display Table 2-4.
MQCINFO Option PEEK Syntax and Examples MQCINFO Option The MQCINFO option displays information about message quick cell (MQC) resources. Note. The MCQINFO option replaces the EXPEDITED option, which in earlier RVUs such as Dnn.xx displays information about expedited request transmissions. Definition of MQCs Message quick cells (MQCs) are data structures that contain information about messages being sent to or received from another process.
Using the MQCINFO Option PEEK Syntax and Examples Using the MQCINFO Option When you enter the command PEEK MQCINFO, an output similar to this example is generated: > PEEK MQCINFO PEEK - T9050G09 - (12NOV04) - (10SEP04) - (APR) SYSTEM \SCQA4 COPYRIGHT TANDEM COMPUTERS INCORPORATED 1981, 1985, 1988, 1990 SYSTEM 22 DEC 2004, 16:39___ELAPSD \SCQA4 45:30:46___CPU 1(NSR-G) MQC CURRENT HIGH FREE PAGE SIZE ENTRIES ENTRIES COUNT COUNT 64 43 43 29 1 128 2 2 2 1 192 65 65 29 1 256 3
Using the MQCINFO Option PEEK Syntax and Examples When you enter the command PEEK /CPU 0/ MQCINFO on a system running Hseries or J-series RVU, an output similar to this example is generated: PEEK - T9050H02 - (01MAY05) - (31MAY05) SYSTEM \HALF3 (C)1981 TANDEM (C)2004 HEWLETT-PACKARD DEVELOPMENT COMPANY, L.P.
Elements of the MQCINFO Display PEEK Syntax and Examples Elements of the MQCINFO Display Table 2-5. MQCINFO Elements Reported in the MQCINFO Display Element Description MQC SIZE Size of each MQC in bytes. CURRENT ENTRIES Number of MQC entries currently allocated and in use. HIGH ENTRIES Highest number of MQC entries ever allocated. FREE COUNT Number of MQCs currently allocated but not in use. PAGE COUNT Number of physical memory pages used for each MQC.
Elements of the MQCINFO Display PEEK Syntax and Examples Example This example displays information about CPU 0, the MQCs from CPU 0, since CPU 0 was last loaded, and for the 10-second period since Report 1: > PEEK / CPU 0 / MQCINFO, DYNAMIC, 2, 10 Report 1: PEEK - T9050G09 - (05AUG02) SYSTEM \TAHOE COPYRIGHT TANDEM COMPUTERS INCORPORATED 1981, 1985, 1988, 1990 22 FEB 2004 , 8:35___ELAPSD SYSTEM \TAHOE 132:26:09___CPU 2(NSR-T) __SAMP MQC SIZE 32 64 96 160 CURRENT ENTRIES 19 48 101 7 HIGH ENTRIES 19
Elements of the MQCINFO Display PEEK Syntax and Examples Report 2: 22 DEC 2004, 17:56___ELAPSD SYSTEM \SCQA4 0:00:10___CPU 1(NSR-G) MQC SIZE 64 128 192 256 CURRENT ENTRIES 43 2 65 3 HIGH ENTRIES 43 2 65 3 FREE COUNT 30 2 33 3 PAGE COUNT 1 1 1 1 MQC SIZE 512 1024 1536 2048 CURRENT ENTRIES 19 25 3 2 HIGH ENTRIES 19 25 3 2 FREE COUNT 19 25 3 2 TABLE SIZE 1024 256 256 127 MQC SIZES 128 192 256 512 1024 1536 2048 MQC SIZES 64-256 512 1,024 1,536 2,048 CONTROL READS 0 18 2 14 3 253 0 TOTAL ALLOCAT
NSAA Option PEEK Syntax and Examples NSAA Option Use the NSAA option to display voluntary rendezvous opportunities (VRO) and Inappropriate I/O Buffer Access counters and reintegration status. When you enter the command PEEK NSAA on a system running H-series or J-series RVU, an output similar to this example is generated: > PEEK NSAA PEEK - T9050H02 - (01MAY05) - (17MAY05) SYSTEM \HALF4 (C)1981 TANDEM (C)2004 HEWLETT-PACKARD DEVELOPMENT COMPANY, L.P.
Elements of the NSAA Display PEEK Syntax and Examples Table 2-6.
PAGING Option PEEK Syntax and Examples PAGING Option Use the PAGING option to monitor processor activity for paging statistics. The default report appears when you run the command PEEK PAGING with no options.
Elements of the PAGING Display PEEK Syntax and Examples Elements of the PAGING Display Table 2-7. PAGING Elements Reported in the PAGING Display (page 1 of 3) Element PAGES Description Reports these paging statistics: PHYSCL — physical memory size in pages. The number in parentheses below the PAGES heading indicates the size of a page in kilobytes. SWAPBL — number of pages not permanently required by the operating system and thus available for swapping.
Elements of the PAGING Display PEEK Syntax and Examples Table 2-7. PAGING Elements Reported in the PAGING Display (page 2 of 3) Element PAGES (continued) Description CLEANQ FAULTS — number of page faults that have occurred. ALLOCS — number of requests for the allocation of a page. DISKREADS— number of times a page was read in from disk. DISKWRITES — number of times a page was written to disk.
Elements of the PAGING Display PEEK Syntax and Examples Table 2-7. PAGING Elements Reported in the PAGING Display (page 3 of 3) Element Description CLOCK Reports these statistics about the algorithm for the page frame selection of the memory manager, which identifies and reallocates the oldest allocated but unused page: ALIASES CALLS — number of times the algorithm was invoked to obtain a page frame. FAILS — number of times the algorithm failed to find a replaceable page.
Elements of the PAGING Display PEEK Syntax and Examples Report 1: PEEK - T9050G09 - (05AUG02) SYSTEM \TOMMY COPYRIGHT TANDEM COMPUTERS INCORPORATED 1981, 1985, 1988, 1990 SYSTEM \TOMMY 26 FEB 2004, 15:26___ELAPSD 23:10:29___CPU 0(NSR-T) __SAMP 1/2,DELAY PAGES: PHYSCL SWAPBL (16Kb) 16384 16181 PAGES: (16 Kb) LOCKED 3725/14159 FREE FREEMIN 8356 7 FREERED 5 UNDUMPED 0 LOCKED(KSEG0) 3725/28495 TOTAL (per sec) FAULTS 7601 0.09 ALLOCS 9433 0.11 TOTAL (per sec) REDHIT 0 0.00 REDBUSY 0 0.
POOL Option PEEK Syntax and Examples POOL Option The POOL option reports on the state of system tables and resources. When you run the command PEEK POOL with no options, the default report appears.
POOL Option PEEK Syntax and Examples When you enter the command PEEK /CPU 0/ POOL on a system running H06.20 and later H-series RVUs or J06.09 or later J-series RVUs, an output similar to this example is generated: PEEK - T9050H02 - (01AUG12) - (11JUN12) - (ATY) SYSTEM \HALF6 (C)1981 TANDEM (C)2004-2008 HEWLETT-PACKARD DEVELOPMENT COMPANY, L.P. 22 JUN 2012 , TLE PCB NRL PTLE PME SHM SEM 3:48___ELAPSD MAXIMUM USED 13 6: 42 443 1 2 1 1 MAX.
Elements of the POOL Display PEEK Syntax and Examples Elements of the POOL Display Table 2-8.
Elements of the POOL Display PEEK Syntax and Examples Table 2-8. POOL Elements Reported in the POOL Display (page 2 of 3) Elements Description* MAX.USED Largest amount of pool space ever used. CUR.USED Amount of pool space currently being used. MAX.FRAG The highest value of CUR.FRAG since system load. CUR.FRAG The number of free space elements that are fragments. MAPPOOL Reports the state of MAPPOOL, a system storage pool of variable size. MAX.
Elements of the POOL Display PEEK Syntax and Examples Table 2-8. POOL Elements Reported in the POOL Display (page 3 of 3) Elements Description* FLEXPOOL SUBPOOL USAGE Reports the state of the FLEXPOOL subpools. MAXIMUM The largest number of subpools to be simultaneously allocated since system load. CURRENT The number of subpools currently being used. ALLOCATED The total number of subpools allocated since system load. DEALLOCATED The total number of subpools deallocated since system load.
Elements of the POOL Display PEEK Syntax and Examples The maximum size of the SYSPOOL system storage pool for TNS/R (HP Tandem NonStop Series/ RISC) processors and itanium processor can exceed the size configured during system generation. Under the heading MAX.SIZE, the current value reported for this pool can appear quite large. The PTLE table has no entries when the processor first comes up after a system load or reload. Entries are added dynamically on a demand basis.
Elements of the POOL Display PEEK Syntax and Examples SHM SEM 1 1 SYSPOOL EXTPOOL MAPPOOL FLEXPOOL SEG TBL 1 1 1000 30 0 0 MAX.SIZE CUR.SIZE INIT.CNF MAX.USED CUR.USED 5520 0 70096 3145498 13591 5520 0 70096 3145498 13591 13249 262144 196585 2097106 13591 5520 0 69744 3006424 1984 5520 0 67368 2995400 1984 MAX.FRAG CUR.
TIME Option PEEK Syntax and Examples TIME Option The TIME option displays the amount of time a given processor has spent on processes, interrupts, and idle time. TIME is one of the default reports displayed when you run PEEK with no options specified.
Elements of the TIME Display PEEK Syntax and Examples Examples 1. This example displays the amount and percentage of time processor 2 has spent on processes and interrupts and the amount and percentage of idle time since the processor was last loaded: > PEEK / CPU 2 / TIME PEEK - T9050G09 - (05AUG02) SYSTEM \VIOLET COPYRIGHT TANDEM COMPUTERS INCORPORATED 1981, 1985, 1988, 1990 SYSTEM 22 FEB 2004, 16:24___ELAPSD TIME: \VIOLET 832:35:40___CPU PROCESSBUSY TIME 88:08:12.538 10.
Elements of the TIME Display PEEK Syntax and Examples IDLE TIME: Since it was last loaded, processor 2 has been idle 86.50 percent of its time. In the 10-second interval shown in Report 2, this processor has been idle 88.62 percent of its time. If this example did not specify DYNAMIC, both reports would show statistics since the processor was last loaded.
Elements of the TIME Display PEEK Syntax and Examples PEEK Reference Manual — 529657-006 2 - 50
Glossary This glossary defines technical terms related to PEEK, to the internal design of the operating system, and to the system architecture for the NonStop server. active process. The process that is currently using the instruction processing unit (IPU) of a processor. Contrast with inactive process. API. See application program interface (API). application program interface (API).
clock Glossary clock. See processor clock or system clock. clock averaging algorithm. An algorithm used by the operating system to keep the processor clocks in a system synchronized. CME. (1) See correctable memory error (CME). (2) The PEEK INTERRUPTS element that reports CME interrupts. See also interrupt. complex instruction-set computing (CISC).
extensible data segment Glossary and flat segments. Extended data segments are allocated by the ALLOCATESEGMENT or SEGMENT_ALLOCATE_ Guardian procedure. extensible data segment. An extended data segment for which swap file extents are not allocated until needed. EXTPOOL. (1) A fixed-size system storage pool. (2) The PEEK POOL element that reports the size of EXTPOOL. fault address.
HP Integrity NonStop NS-series servers Glossary HP Integrity NonStop NS-series servers. The HP Integrity NonStop servers having product numbers beginning with the letters NS. These servers implement the ServerNet architecture and run the NonStop operating system. HP NonStop Blade Complex (NSBC). The set of one, two, or three NonStop Blade Elements and their associated LSUs. For the first release of Integrity NonStop servers, a NonStop Blade Complex contains one to four logical processors.
IOS Glossary IOS. I/O subsystem. Itanium Processor. The processor used in the Integrity NonStop server. Contrast with CISC processor and RISC processor. LDEV . See logical device. locked pages. The pages in a processor that are not available for swapping because they are currently assigned or are reserved for use by the operating system. logical device. (1) A process that can be accessed as if it were an I/O device; for example, the operator process is logical device LDEVOPR.
message system Glossary message system. A set of operating system procedures and data structures that handles the mechanics of exchanging messages between processes, which might be running in the same processor or different processors. millicode. The system’s lowest-level machine-dependent code, often coded in assembler language. TNS/R millicode and TNS/E millicode are functionally similar to the microcode on TNS systems.
OSS SEM Glossary OSS SEM. The table that contains all the OSS semaphores created in this processor by the semget() function. OSS SHM. The table that defines all the OSS Shared Memory segments created in this processor by the shmget() function. The term, OSS shared memory, distinguishes these segments from the Guardian shared memory segments. page fault. A reference to a logical page that is not currently in physical memory.
PPL table Glossary PPL table. A table containing process pair list (PPL) entries. See also process-pair list (PPL). prepaging. On TNS processors, a technique that involves transferring extra pages to reduce the number of reduce the number of page faults. Prepaging does not occur on TNS/R and TNS/E processors. primary path. A path enabled as the preferred path. When a primary path is disabled, an alternate (backup) path becomes the primary path. Contrast with backup path. process.
processor clock Glossary processor clock. A hardware timer on each processor that keeps processor time (the number of microseconds since system load). PTLE. See process time-list element (PTLE). ready processes. Processes that are prepared to become active. reduced instruction-set computing (RISC).
Glossary ServerNet system area network (ServerNet SAN) response to requests received from clients across a network. For example, the NonStop range of servers provides transaction processing, database access, and other services. (3) A process or program that provides services to a client or a requester.
system services Glossary system services. The tasks performed on behalf of the user or user programs by the operating system, including formatting, process control, I/O support, performance measurement, process-pair support, standard security, and transaction management. Contrast with core services. system time. The time represented by any synchronized processor clock in the system. system-load environment. The software environment that exists before the operating system is fully loaded and operational.
UCME Glossary traps (ARITHOV), stack overflow traps (STKOV), and Measure sampling interrupts (SAMPLE). UCME. (1) See uncorrectable memory error (UCME). (2) The PEEK INTERRUPTS element that reports UCME interrupts. See also interrupt. uncorrectable memory error (UCME). A multiple-bit error in an addressable memory location. The operating system cannot compensate for such errors. Contrast with correctable memory error (CME). unlocking memory.
Index A ALIASES element 2-38 ALL option 2-2, 2-7 ALLOCATED element 2-44 ALLOCS element 2-37 ARITH OVERFLOW element 2-24 Arithmetic overflow trap 2-23 ARITHOV element 2-23 Asterisks in PEEK output 2-4 B BKPT element 2-23 Breakpoint interrupts 2-23 BUS element 2-23 Bus receive interrupts 2-23 BUS SENDS elements 2-26 C CALLS element 2-38 Channel error interrupts, special 2-23 CLEANQ element 2-37 CLOCK elements 2-38 CME element 2-23 CME option 2-2, 2-13, 2-14 CMEs See Correctable memory errors (CMEs) COMM ele
H Index M FRLST:HITS element 2-37 FULLS element 2-37 H HARD CME PAGES element 2-15 HELP option 2-3, 2-18 HIGH ALLOCATED SEGMENTS element 2-30 HIGH ALLOCATEDPAGES element 2-30 HIGH ENTRIES element 2-30 High-priority I/O interrupts 2-23 HIIO element 2-23 HITS element 2-37 I IDLE element 2-24 IDLE TIME element 2-47 IFAIL element 2-23 IIO element 2-23 ILLEGAL ADDRESS element 2-24 INIT option 2-3, 2-16, 2-18/2-19 INIT.
O Index O Operations and Service Processor (OSP) 2-23 OSP See Operations and Service Processor (OSP) OSP element 2-23 OSS SEM 1-1, 2-13, 2-18, 2-19, 2-21, 2-41, 2-42, Glossary-7 OSS SHM 1-1, 2-13, 2-18, 2-19, 2-21, 2-41, 2-42, Glossary-7 OTHER IPS AND APS element 2-24 OUT option of TACL RUN command 1-5, 2-1 Overflow condition in PEEK data structures 2-4 P PAGE COUNT element 2-30 Page-fault interrupts 2-23 PAGING option 2-4, 2-16, 2-35/2-38 PCB resetting maximum values for 2-18 syntax description 2-42 PCB
T Index System tables resetting maximum values for 2-18/2-19 of MQCINFO option 2-30 UNSEQENCED element 2-26 Unsequenced packets 2-25 T X TABLE SIZE element 2-30 Tables MQC finder 2-27 system description 2-42 resetting maximum values for 2-18/2-19 TACL RUN command, using, with PEEK program 1-5/1-7, 2-1 Time 2-18, 2-42 TIME element 2-23, 2-24 TIME option 2-4, 2-47/2-49 Time-list control blocks See Time-list elements (TLEs) Time-list elements (TLEs) description 2-42 resetting maximum values for 2-18 use