
PEEK Reference Manual

Getting Started With PEEK
PEEK Reference Manual — 529657-006
1 - 4
Monitoring Another System
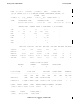
FAULTS ALLOCS DISKREADS DISKWRITES MUTEXCRAX NONMUTEXCRAX
TOTAL 11983 739987 6741 29 185 104
(per sec) 2.34 144.54 1.31 0.00 0.03 0.02
REDHIT REDBUSY REDTASK
TOTAL 0 0 0
(per sec) 0.00 0.00 0.00
CLEANQ: FULLS FRLST:HITS CLOCK:CALLS FAILS CYCLES ALIASES: FAILS
0
0 739234 753 0
1.02 0 0
Monitoring Another System
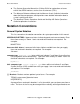
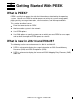
You can also use PEEK to monitor processor activity on another system in your
network. For example:
> \KONA.PEEK
This command returns the default TIME, POOL, and PAGING statistics for a processor
on the node named \KONA.
Using PEEK Options
Use the PEEK options listed in Table 1-1 to obtain specific statistical information about
processors and to help you run the PEEK program.
Note.
PEEK examines the internal data structures of the operating system. These internal data
structures might differ with each RVU. To avoid compatibility issues, use the product
version (PV) of PEEK that matches the RVU of the operating system running in the
processor that PEEK examines.
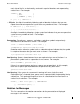
For systems running J06.06 and earlier J-series RVUs or H06.17 and earlier H-series
RVUs, NRL is displayed as a four-line output with the small-index (S) and medium-index
(M) entries for NRL and PPL on separate lines. This four-line output is compressed to a
single-line NRL output from J06.07/H06.18 series onwards.
For systems running J06.14 and later J-series RVUs or H06.25 and later H-series RVUs,
the enhanced PME table, OSS SHM and OSS SEM information are included in the output.
For systems running J06.09 and later J-series RVUs or H06.20 and later H-series RVUs,
the FLEXPOOL64 information is included in the output.