
PEEK Reference Manual


PEEK Syntax and Examples
PEEK Reference Manual — 529657-006
2 - 4
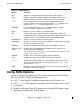
Syntax to Run PEEK
NS[AA]
displays voluntary rendezvous opportunities (VRO) and inappropriate I/O buffer
access counters and reintegration status. For more information, see NSAA
Option on page 2-33.
PA[GING]
displays paging statistics. For more information, see PAGING Option on
page 2-35.
PO[OL]
displays pool-management statistics. For more information, see POOL Option
on page 2-40.
TIME
displays the amount of time the processor has spent on processes, interrupts,
and idle time. For more information, see TIME Option on page 2-47.
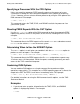
Consideration
On high-activity systems or systems that rarely undergo a system load, the internal
structures that collect PEEK statistics can reach their maximum capacity and then
overflow. In PEEK output, an overflow condition is indicated by a negative number or a
string of asterisks (****).
Examples
These examples show the PEEK command with some of its options and with the CPU
option of the TACL RUN command. For examples that show the output of each PEEK
option, see the subsection describing the option later in this section.
1. To run two PEEK samples on the default processor with a 1-second delay (the
default value) between samples:
> PEEK 2
2. To run two PEEK samples on processor 1 with a 10-second delay between
samples:
> PEEK / CPU 1 / 2, 10
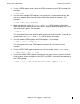
3. To run two PEEK CME samples on processor 1 with a 10-second delay between
samples:
> PEEK / CPU 1 / CME, 2, 10
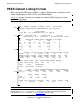
4. To display four PAGING reports about processor 1 with a 10-second delay,
in order
to compare paging statistics for different time periods:
> PEEK / CPU 1 / 4, 10, PAGING, DYNAMIC