
PEEK Reference Manual


PEEK Syntax and Examples
PEEK Reference Manual — 529657-006
2 - 32
Elements of the MQCINFO Display
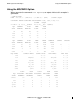
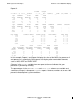
Report 2:
SYSTEM \SCQA4
22 DEC 2004, 17:56___ELAPSD 0:00:10___CPU 1(NSR-G) __SAMP 2/2,DELAY 10
MQC CURRENT HIGH FREE PAGE
SIZE ENTRIES ENTRIES COUNT COUNT
64 43 43 30 1
128 2 2 2 1
192 65 65 33 1
256 3 3 3 1
MQC CURRENT HIGH FREE TABLE CURRENT STEALS UNLOCKS
SIZE ENTRIES ENTRIES COUNT SIZE LIMIT
512 19 19 19 1024 1024 0 0
1024 25 25 25 256 256 0 0
1536 3 3 3 256 256 0 0
2048 2 2 2 127 127 0 0
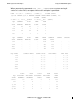
MQC SIZES CONTROL READS CONTROL HITS DATA READS DATA HITS
128 0 100.0% 0 100.0%
192 18 100.0% 12 100.0%
256 2 100.0% 0 100.0%
512 14 100.0% 14 100.0%
1024 3 100.0% 3 100.0%
1536 253 100.0% 253 100.0%
2048 0 100.0% 0 100.0%
TOTAL HIGH TOTAL HIGH TOTAL
MQC ALLOCATED ALLOCATED ALLOCATED ALLOCATED FREE
SIZES SEGMENTS SEGMENTS PAGES PAGES PAGES
64-256 37 37 5 5 291
512 4 4 1 1 31
1,024 2 2 2 2 14
1,536 3 3 1 1 23
2,048 2 2 1 1 15
In this example, Report 1 and Report 2 display the sizes of the MQCs for processor 2
and processor 1 respectively. Both reports also display other nonvariable elements
such as MQC SIZE and TABLE SIZE.
Changes in the STEALS variable from one report to the next indicate that your
processor is performing normally.
The percentages in the CONTROL HITS
and DATA HITS columns are variable and
sometimes change in subsequent DYNAMIC reports. However, numbers at or near 100
percent indicate optimal system conditions.