
ProCurve Switches 2512 and 2524 Management and Configuration Guide

4-22
Using the HP Web Browser Interface
Status Reporting Features
Using the HP Web Browser
Interface
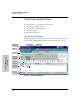
Note When troubleshooting the sources of alerts, it may be helpful to check the
switch’s Port Status and Port Counter windows and the Event Log in the
console interface.
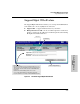
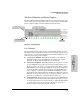
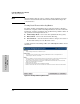
Viewing Detail Views of Alert Log Entries
By double clicking on Alert Entries, the web browser interface displays a
Detail View or separate window detailing information about the events. The
Detail View contains a description of the problem and a possible solution. It
also provides four management buttons:
■ Acknowledge Event – removes the New symbol from the log entry
■ Delete Event – removes the alert from the Alert Log
■ Cancel Button – closes the detail view with no change to the status of
the alert and returns you to the Overview screen.
A sample Detail View describing an Excessive CRC/Alignment Error alert is
shown here.
Figure 4-14. Example of Alert Log Detail View