
SNAX/XF and SNAX/APN Configuration and Management Manual

PTrace Reference for SNAX/XF and SNAX/APN
SNAX/XF and SNAX/APN Configuration and Management Manual—425836-006
15-4
Using TRACE and PTrace for Line Traces
When examining the trace file using PTrace, you can choose among a number of
PTrace SELECT or SELMASK options to display only specified types of trace records.
For service manager traces, you can also use FILTER options to limit the information
displayed.
Using TRACE and PTrace for Line Traces
For all SNAX lines, the line handler traces upper-level activity and some lower-level
activity. For line type 58,5, the controller traces additional level-1 and level-2 activity.
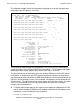
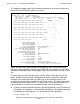
In the TRACE command, the following keywords select line type 58,5 events for
tracing:
In PTrace, you can select specific types of line type 58,5 records with the SELECT
command by using the keywords beginning with CLIP. You can also select specific
types of line type 58,5 records by using the SELMASK command and setting mask bit
15, plus the desired bits in the range 16 through 31. For example, you can select all
controller events with the following PTrace command:
SELMASK %H0001FFFF
For details, see the subsystem-specific descriptions of the SELECT and SELMASK
Commands on page 15-12.
When interpreting controller-generated trace records, note that these records reflect
the data as it appears to the controller, rather than as it appears to SNAX. For
example, in the “CLIP” SELECT keywords and in the displays of type 255 trace records
generated by the line type 58,5, In and Out are defined with respect to the controller
that created the trace record. This differs from the meaning of In and Out in trace
records generated by the line handler, such as the type 2 and 102 (level 2) records; the
line handler labels trace records as In and Out with respect to itself. Thus, for
example, the same frame labeled Frame Out in a trace record generated by a line type
58,5 is labeled Frame In when traced by the level-2 portion of the line handler.
For X.25 lines, the line handler traces level-2 activity and message-system
communication with the X25AM I/O process. If needed, you can trace the activity within
X25AM by using the X25AM trace facility. For information about collecting X25AM
traces and formatting them using PTrace, see the SCF Reference Manual for X25AM.
Using TRACE and PTrace for Service-Manager Traces
Service-manager traces record SNA request and response communication with the
line handler, buffer pool usage, and SPI request and response communication through
the DSM interface. When you collect a trace, you should use the SELECT ALL option
of the TRACE command, and set RECSIZE to at least 2048 bytes, if your trace file is to
DI CSSLVL2 PROCENTRY
DO CCSTATE CCREQ
CSSLVL1 HOSTREQ CCPROCENTRY