
SNMP Configuration and Management Manual

SNMP Agent PTrace Facility
SNMP Configuration and Management Manual—424777-006
6-2
Introduction to PTrace
The following steps are involved in recording and displaying trace data.
1. To start the trace interactively, issue the SCF TRACE command. For example, to
start a trace operation of method invocations only on NonStop agent process
$ZSNMP and write results into the file named $DATA.SNMP.TRACE, you would
enter the following SCF TRACE command:
-> TRACE PROCESS $ZSNMP, TO $DATA.SNMP.TRACE, SELECT METHOD
2. Collect the trace data while you perform operations related to the problem that you
are analyzing.
3. Stop the trace by issuing another SCF TRACE command. The following command
stops the trace for the NonStop agent process $ZSNMP:
-> TRACE PROCESS $ZSNMP, STOP
4. Display the trace file with the PTrace utility.
Run PTrace from TACL to display the traces in the file named TRACE:
PTRACE FROM $DATA.SNMP.TRACE
For additional information on using PTrace, refer to the PTrace Reference Manual.
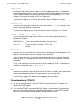
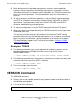
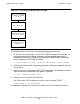
Figure 6-1. Recording and Displaying Trace Data
Collect the trace data.
Stop the trace by using the
SCF TRACE command.
Display the trace file by
using PTrace.
Start the trace interactively
by using the SCF TRACE
command
VST007.vsd