
SQL/MP Query Guide

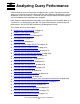

Analyzing Query Performance
HP NonStop SQL/MP Query Guide—524488-003
6-4
Simple Query Example
Simple Query Example
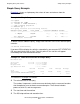
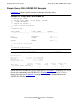
Example 6-1 shows a simple query that selects all rows and columns from the
EMPLOYEE table:
To obtain statistics about the query, simply enter DISPLAY STATISTICS after the query
executes:
>>DISPLAY STATISTICS ;
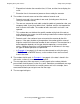
If you want SQL to display the statistics automatically, you can enter SET STATISTICS
ON at any point during the session. From this point on, the statistics will appear
immediately after each command executes.
The statistics in Example 6-2 indicate:
•
The estimated cost of the query
The number 2 represents a relative measure derived using the same cost functions
that the optimizer uses to choose an execution plan. The estimate includes
processor, disk I/O, and message costs.
•
The start time and the end time
•
The SQL elapsed time and execution time:
Example 6-1. Simple Query
23> SQLCI
>> PREPARE Q1 FROM
+> SELECT * FROM EMPLOYEE ;
--- SQL command prepared.
>> EXECUTE Q1 ;
The query returns the following result:
EMPNUM FIRST_NAME LAST_NAME DEPTNUM JOBCODE SALARY
------ ------------- ------------- ------- ------- ----------
1 ROGER GREEN 9000 100 175500.00
. . . . .
568 JESSICA CRINER 3500 300 39500.00
--- 57 row(s) selected.
Example 6-2. DISPLAY STATISTICS for Simple Query
Estimated Cost 2
Start Time 95/09/11 09:06:07.864928
End Time 95/09/11 09:06:08.196387
Elapsed Time 00:00:00.331459
SQL Execution Time 00:00:00.112590
Records Records Disk Message Message
Lock
Table Name Accessed Used Reads Count Bytes
\SQL1.$DATA8.PERSNL.EMPLOYEE
57 57 0 3 2916