
SQL/MP Query Guide


Analyzing Query Performance
HP NonStop SQL/MP Query Guide—524488-003
6-84
Second Formulation
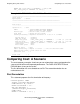
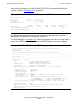
After executing the query, use the DISPLAY STATISTICS command to display the
statistics shown in Example 6-52 on page 6-84.
By reformulating the query to remove the unnecessary join operation, you have
reduced the estimated cost of the query from 50 to 4.
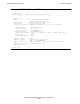
The EXPLAIN plan in Example 6-53, shows that the plan now consists of two steps: a
scan of the ODETAIL table and a scan of the PARTS table to satisfy the subquery.
Example 6-52. DISPLAY STATISTICS Output for QUERY2
Estimated Cost 4
Start Time 95/09/11 09:08:17.871610
End Time 95/09/11 09:08:18.010648
Elapsed Time 00:00:00.139038
SQL Execution Time 00:00:00.016799
Records Records Disk Message Message Lock
Table Name Accessed Used Reads Count Bytes
\SQL1.$DATA8.SALES.PARTS
1 1 0 2 188
\SQL1.$DATA8.SALES.ODETAIL
72 4 0 5 744
Example 6-53. EXPLAIN Plan for QUERY2 (page1of2)
<<<<<<<<<<<<<<<<<<<<<<<<<<<<<<<<<<<<<<<<<<<<<<<<<<<<<<<<<<<<
Query plan 1
SQL request : Select
<<<<<<<<<<<<<<<<<<<<<<<<<<<<<<<<<<<<<<<<<<<<<<<<<<<<<<<<<<<<
---------------------------------------------------------------------------
Plan step 1
---------------------------------------------------------------------------
Operation 1.0 : Scan
Table : \SQL1.$DATA8.SALES.ODETAIL
with correlation name O
Access type : Record locks, stable access
Lock mode : Chosen by the system
Column processing : Requires retrieval of 1 out of 4 columns
Access path 1 : Primary
SBB for reads : Not used
Begin key pred. : None
End key pred. : None
Index selectivity : Expect to examine 100% of rows from table
Index pred. : None
Base table pred. : Will be evaluated by the disk process
( O.PARTNUM = 5100 ) AND ( QTY_ORDERED < AVG (
QTY_AVAILABLE ) .. result of plan step 2 )
Pred. selectivity : Expect to select 1.3889% of rows from table
Executor pred. : None
Table selectivity : Expect to select 1.3889% of rows from table
Expected row count: 1 row after the scan
Operation cost : 3