
SQL/MX 2.x Query Guide (G06.24+, H06.03+)

HP NonStop SQL/MX Query Guide—523728-003
4-1
4
Reviewing Query Execution Plans
Use the information in this section to display and understand how your query is
optimized. At a later time, you might use this information to make decisions about
forcing execution plans, described in Section 5, Forcing Execution Plans.
•
Displaying Execution Plans on page 4-1
•
Using DISPLAY_EXPLAIN to Review the Execution Plan on page 4-6
•
Optimization Tips on page 4-9
•
Reviewing Run-Time Statistics on page 4-20
Displaying Execution Plans
Use these methods to display the query execution plan:
•
Use the EXPLAIN function to query and display certain columns or all columns of
information about execution plans.
•
Use the DISPLAY_EXPLAIN shortcut to display all available information about
execution plans.
•
Use the Visual Query Planner graphical user interface (GUI) to extract and display
execution plans generated by the SQL/MX optimizer for DML statements.
When you view the information by using the EXPLAIN function or by using the
DISPLAY_EXPLAIN command, the results are shown in machine-readable format.
Although you can interpret the results of these execution plans, you can view results
more easily with the Visual Query Planner application.
Using the EXPLAIN Function
The EXPLAIN function is a table-valued stored function that returns information about
execution plans for SQL DML statements. You can use the information in the EXPLAIN
output for these types of tasks:
•
Reviewing the chosen execution plan.
•
Identifying problems and tuning queries.
•
Determining whether the optimizer chose the optimal plan.
You can query and display certain columns or all columns of the information about
execution plans by using the EXPLAIN function.
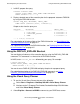
You can selectively display columns from the execution plan by using the EXPLAIN
function: