
SQL/MX 2.x Query Guide (G06.24+, H06.03+)

Reviewing Query Execution Plans
HP NonStop SQL/MX Query Guide—523728-003
4-3
The Optimizer and Executor
For further information about creating ODBC data sources, see the ODBC Driver
Manual for Windows.
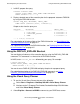
3. In the top pane of the Visual Query Planner window, enter your query.
4. Select Explain > Get Explain Plan to display your query execution plan.
The operator tree for the query execution plan appears in the lower left pane of the
Visual Query Planner window. Summary detail for the operators displays in the
lower right pane. Additional information about each operator is included in the
Properties dialog box, which is available from the Explain menu.
For a detailed description of the Visual Query Planner, see Using the Visual Query
Planner on page 4-13.
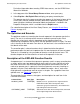
The Optimizer and Executor
The optimizer creates an execution plan for each operator in the operator tree for the
query. The cost is an estimate of the resources needed to execute a plan. Each
operator has a local cost, which is dependent on the algorithm chosen for
implementing the operator and the values that the operator receives as input. The local
cost is the cost for the leaf node. From then on, the local cost is the cumulative cost of
that branch of the node.
The execution plan is chosen based on what is determined to be the optimal
performance plan: the total cost to produce the first row of output or last row of output.
Total cost is estimated by using a number of formulas to roll up the local costs. The
formulas depend on the characteristics of each of the operators in the tree.
Description of the EXPLAIN Function Results
An operator tree is a structure that represents operators used in a query execution plan
as nodes, with at most one parent node for each node in the tree, and with only one
root node. Each row in the EXPLAIN output corresponds to one node in the tree. A
node of an operator tree is a point in the tree that represents an event (involving an
operator) in a plan. Each node might have subordinate nodes—that is, each event
might generate a subordinate event or events in the plan. For a graphical view of an
operator tree, see Figure 4-2 on page 4-15.
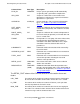
The next table lists the columns, data types, and descriptions for each item in the
EXPLAIN result table:
Column Name Data Type Description
MODULE_NAME
CHAR(60)
Module name as specified in the argument to the
EXPLAIN function; NULL for dynamic SQL
statements (prepared statements); truncated on the
right if longer than 60 characters.
STATEMENT_NAME
CHAR(60)
Statement name after wild-card expansion; truncated
on the right if longer than 60 characters.