SQL/MX UPDATE STATISTICS Enhancements Introduction ................................................................................................................................... 2 UPDATE STATISTICS Background ...................................................................................................... 2 Tests Performed .............................................................................................................................. 2 Test Results ..................................
Introduction HP NonStop SQL/MX Release 2.1.1 includes a new internal algorithm that improves the accuracy of histograms created by the UPDATE STATISTICS statement. This white paper describes several tests that were performed to measure the improvements in histogram accuracy. The test results and accompanying discussion provide clues to understanding how statistics are updated and how to use the UPDATE STATISTICS statement more effectively.
• Real customer data The tables ranged in size from approximately 10 million to 1 billion rows, and the UPDATE STATISTICS sample sizes ranged from 0.1 to 20 percent. For each data set and sample size, UPDATE STATISTICS was run both with and without the accuracy enhancement. For each column tested, the estimated UEC was retrieved from the histogram tables and recorded. The UEC estimates were then compared to the actual or true UEC for each column, and the error was determined.
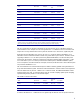
Table Row Count Sample* Pre-2.1.1 Error 2.1.1 Error Uniform 10,000,000 1% row 1905.5% 4.8% Uniform 10,000,000 5% row 558.5% 4.3% Uniform 10,000,000 10% row 191.4% 4.2% Uniform 10,000,000 20% row 108.6% 4.1% Normal 10,000,000 1% row 806.3% 18.8% Normal 10,000,000 5% row 15.6% 10.2% Normal 10,000,000 10% row 12.6% 6.7% Normal 10,000,000 20% row 9.7% 5.2% Zipf 10,000,000 1% row 786.3% 6.2% Zipf 10,000,000 5% row 833.1% 4.3% Zipf 10,000,000 10% row 626.
The third and final test data set consisted of six SQL/MP tables containing actual customer data. The tables contained between 7 and 24 columns and ranged from about 15 million rows to just under 1 billion rows. Row-level sampling was used with various sample sizes. The results are shown in this table: Table Row Count Sample Pre-2.1.1 Error 2.1.1 Error Table 1 23,074,465 1% row 64.2% 31.7% Table 1 23,074,465 2% row 77.3% 24.7% Table 2 22,495,302 1% row 242.8% 51.
For each test table, the results show the number of columns on which statistics are gathered and the actual run times, in minutes, for the pre-2.1.1 and Release 2.1.1 versions of UPDATE STATISTICS. For the same sample size, the Release 2.1.1 version of UPDATE STATISTICS is approximately 1 to 2 percent slower than its predecessors.. However, with Release 2.1.1, you can use smaller sample sizes and achieve better performance and accuracy.
For more information www.hp.com/go/ntl © 2005 Hewlett-Packard Development Company, L.P. The information contained herein is subject to change without notice. The only warranties for HP products and services are set forth in the express warranty statements accompanying such products and services. Nothing herein should be construed as constituting an additional warranty. HP shall not be liable for technical or editorial errors or omissions contained herein.