
SQL/MX UPDATE STATISTICS Enhancements


3
• Real customer data
The tables ranged in size from approximately 10 million to 1 billion rows, and the UPDATE
STATISTICS sample sizes ranged from 0.1 to 20 percent.
For each data set and sample size, UPDATE STATISTICS was run both with and without the accuracy
enhancement. For each column tested, the estimated UEC was retrieved from the histogram tables and
recorded. The UEC estimates were then compared to the actual or true UEC for each column, and the
error was determined. For each test table, the results presented in this paper show the average UEC
estimation error for the columns on which statistics were updated.
The UEC estimation error for a column was calculated according to this formula:
Error = |estimatedUEC – actualUEC| / actualUEC * 100
For example, suppose this UPDATE STATISTICS statement is executed:
UPDATE STATISTICS FOR TABLE Employee ON (Salary) SAMPLE RANDOM 1 PERCENT;
As part of executing this statement, UPDATE STATISTICS stores the estimated UEC for the Salary
column in the histogram metadata tables. Assume for this example that the UEC estimated by
UPDATE STATISTICS from the 1 percent random sample is 45,000, while the actual UEC is 50,000.
The estimation error, in this case, is 10 percent (|45,000 – 50,000| / 50,000 * 100).
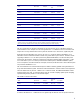
Test Results
The first test data set consisted of SQL/MX tables containing synthetic data drawn from Uniform,
Normal, and Zipf distributions. In the Uniform distribution, distinct values occur an equal number of
times. This distribution was included in the testing because it is well understood, and generating data
from it is straightforward. The Normal distribution is the well-known bell curve that has a frequently-
occurring mean, or average value, and then values that occur less frequently as the distance from the
mean increases. Many phenomena are normally distributed, such as the height of humans and
measurements like reading ability and job satisfaction. The Zipf distribution is characterized by high
skew, where there are a few very large values and many smaller values. Examples of this distribution
are city populations, frequency of access to Web pages, and corporate revenue.
Each of the test tables contained 10 million rows and three columns on which histograms were built.
Sample sizes from 1 to 20 percent were tested. Row-level sampling was used in all cases. UPDATE
STATISTICS also supports cluster sampling, which is an alternative to row-level sampling. In row-level
sampling, a table is scanned and a test performed on each row to see if it should be included in the
sample. The outcome of this test depends only on the specified sample size, and not on the values in
a row. In cluster sampling, a similar scan is done, but the test is performed on each cluster (a
contiguous set of disk blocks), rather than on individual rows. If a cluster is selected, all the rows in
the cluster are added to the sample. Cluster sampling is much faster than row sampling. Clusters that
are not selected for a sample are skipped and not actually read from disk, thus there are fewer I/O
operations compared to row sampling. However, cluster sampling tends to produce samples that are
less random, which generally results in less-accurate statistics.
The test results for the first data set are shown in this table: