
SQL/MX UPDATE STATISTICS Enhancements


4
The error values that are reported in the table are the average UEC errors of the three columns in
each test table for each sample size. The average Release 2.1.1 estimation error for each table and
sample size is always less than the error for previous releases and, in most cases, significantly less.
While the average estimation error is less in all cases, in a couple of instances the Release 2.1.1
estimation error for individual test table columns was greater than in prior releases. Therefore, when
upgrading to Release 2.1.1, the UECs produced by UPDATE STATISTICS, and the execution plans
produced by the compiler, should be examined for performance-sensitive tables and queries. In the
rare cases where a pre-2.1.1 release produced more efficient plans, UPDATE STATISTICS options,
such as sample size, should be tuned (for example, increased) so that the same or more efficient plans
are produced with Release 2.1.1.
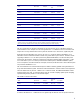
The second test data set consisted of three SQL/MX tables containing synthetic data generated for a
large retail demonstration system. The tables contained between 4 and 66 columns and ranged from
about 40 million rows to just over 1 billion rows. In this set of tests, the UPDATE STATISTICS cluster-
sampling option was used. As discussed earlier, the use of cluster sampling speeds up the sampling
operation but generally results in a less-random sample.
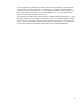
The results are shown in this table:
Table Row Count Sample
Pre-2.1.1
Error
2.1.1 Error
Table 1 39,975,000 1% Cluster 3807.3% 73.5%
Table 2 1,007,520,004 0.1% Cluster 12.0% 0.0%
Table 3 1,086,420,000 0.1% Cluster 256.9% 10.9%
As before, the Release 2.1.1 estimation error is significantly less than the error for previous releases.
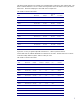
Table Row Count Sample*
Pre-2.1.1
Error
2.1.1 Error
Uniform 10,000,000 1% row 1905.5% 4.8%
Uniform 10,000,000 5% row 558.5% 4.3%
Uniform 10,000,000 10% row 191.4% 4.2%
Uniform 10,000,000 20% row 108.6% 4.1%
Normal 10,000,000 1% row 806.3% 18.8%
Normal 10,000,000 5% row 15.6% 10.2%
Normal 10,000,000 10% row 12.6% 6.7%
Normal 10,000,000 20% row 9.7% 5.2%
Zipf 10,000,000 1% row 786.3% 6.2%
Zipf 10,000,000 5% row 833.1% 4.3%
Zipf 10,000,000 10% row 626.0% 4.2%
Zipf 10,000,000 20% row 208.8% 4.1%
*The UPDATE STATISTICS sample size can be specified as a percentage of the rows in a table (for
example, 1%) or as an absolute number of rows (for example, 1000000, denoted as 1M in this
paper). The sample methods used for testing were row-level sampling and cluster sampling.