
SST Operations Bridge Administration Guide, Version 1.1
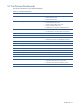
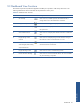
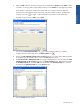
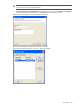
Table Of Contents
- SST Operations Bridge Administration Guide
- Preface
- Chapter 1: HP SST/OB: Overview
- Chapter 2: Getting Started
- Chapter 3: SST/OB Client Application
- Chapter 4: Application Options
- Chapter 5: User Profiles and Permissions
- Chapter 6: Policies
- Chapter 7: Global Parking and SLA Timers
- Chapter 8: Views
- Chapter 9: Dashboards
- Chapter 10: Terminal Sets
- Chapter 11: Faults and Fault Categories
- Chapter 12: Closure Codes
- Chapter 13: Object State Codes
- Chapter 14: Email Alerts
- Chapter 15: Thresholds and Threshold Alert
- Chapter 16: Commands
- Chapter 17: Terminal Trees
- Chapter 18: Action History
- Chapter 19: Data Management
- Chapter 20: Configuring Hours of Operation
- Appendix A: SST/OB Grid Features
- Appendix B: SST/OB Configuration Client Settings
- Appendix C: SST/OB Import Utility Configuration Parameters
- Document Feedback Form

Dashboards 94
9-2 Pre-Defined Dashboards
SST/OB provides the following pre-defined Dashboards:
Table 9-1 Pre-Defined Dashboards
S. No Dashboard Name Views Available
1 BASE24 Network Dashboard • BASE24 Network Statistics
• BASE24 Network Chart
• BASE24 Network Policy
2 Monitoring • Printer/Paper/Other Supply Problems Policy View
• Cashout Problems Policy View
• Communication Problems Policy View
• Hardware Problems Policy View
• In Maintenance (in Supervisor mode) Policy View
3 No Transactions on Terminals • No Transaction for more than 12 hours Local View
• No Transaction for more than 24 hours Local View
4 Out of Service Out of Service Policy View
5 Overall Status Graph Network-wide View Local View
6 Region based Monitoring • Terminals Out of Service – Region wise Local View
• Terminals Out of Service Count/Region Local View
7 Statistics by City Statistics by Cities Local View
8 Statistics by Device Handler Statistics by Device Handlers Local View
9 Statistics by Line Process Statistics by Line Processes Local View
10 Statistics by Logical Network Statistics by Logical Networks Local View
11 Statistics by Region Statistics by Regions Local View
12 Statistics by Resource Node Statistics by Resource Nodes Local View
13 Statistics by State Statistics by States Local View
14 XPNET Graphs Terminals Count Vs. XPNET Entity Down Local View
15 XPNET Impacted Terminals Monitoring • Terminals Down by Device Handler Policy View
• Terminals Down By Line Process Policy View
• Terminals Down by Resource Node Policy View
16 XPNET/Terminals/Region-wise View XPNET/Terminals/Region-wise View Local View