
SST Operations Bridge Users Guide

Overview of SST/OB User Interface 14
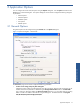
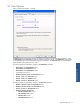
2-5 Toolbar
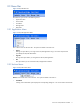
Figure 2-9 SST/OB Toolbar – Dashboards Tab
The Toolbar is displayed just below the Tabs bar in the SST/OB window. The buttons available on the toolbar
depend upon the tab selected.
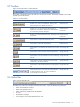
Table 2-1 SST/OB Toolbar
Buttons Description Available For
Enables you to create a new dashboard. Clicking on the
button displays the New Dashboard dialog box.
Dashboards Tab
Enables you to view and manage dashboards/policies,
depending on tab selected. Clicking on the button displays
the corresponding Properties dialog box.
Dashboards Tab
Policies Tab
Enables you to delete Dashboards/Policies, depending on the
tab selected.
Dashboards Tab
Policies Tab
Use this button to suspend the data refresh process. Dashboards Tab
Use this button to refresh the data displayed. Dashboards Tab
Use this button to view details for the selected action in Action
History.
Action History Tab
Use this button to edit custom data in the Manage Data tab. Manage Data Tab
Use this button to save the modifications made in the Manage
Data tab.
Manage Data Tab
Use this button to save the modifications made in the data
automatically in the Manage Data tab.
Manage Data Tab
Use this button to refresh data displayed in the Manage Data
tab.
Manage Data Tab
Use this drop-down box to select the data to be displayed in
the Manage Data tab page. The options available are
Terminal Profiles and Custom Data.
Manage Data Tab
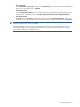
2-6 Status Bar
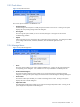
Figure 2-10 SST/OB Status Bar
The Status bar can be seen at the base of the SST/OB window. It provides the following information:
• Status of the Database connection
• Status of the Application Server
• Status of data being refreshed from the database
• Tool tips
• Miscellaneous messages
• Local computer’s time and the Database Server time