SST Operations Bridge Web Client Guide Part number: 544631-002 Second edition: 07/2009
Legal notices Hewlett-Packard makes no warranty of any kind with regard to this manual, including, but not limited to, the implied warranties of merchantability and fitness for a particular purpose. Hewlett-Packard shall not be held liable for errors contained herein or direct, indirect, special, incidental or consequential damages in connection with the furnishing, performance, or use of this material.
Contents Preface Before You Begin ..................................................................................................................................... 5 Who Should Read This Guide ................................................................................................................... 5 Goals of Documentation ........................................................................................................................... 5 Organization ..................................
5-4-1 5-4-2 5-4-3 Introduction ....................................................................................................................... 42 Reports Generation ............................................................................................................ 42 Reports Toolbar ................................................................................................................. 44 Appendix A SST/OB Web Configuration Parameters ............................................
Preface SST Operations Bridge Web Client is specially designed to provide an across-the-board solution for monitoring Problem, Change and Asset management in your Terminal environment over the Internet. Before You Begin As the administrator who administers the SST/OB Web Client, you should be familiar with the Terminal environment, HP NonStop Servers, network protocols, client/server architecture, and basic Microsoft Windows navigation.
HP SST Operations Bridge Documentation Manual Description Media SST Operations Bridge Concepts Guide Provides information on the SST/OB product, the features/benefits the software offers along with its architecture and data-flow. PDF SST Operations Bridge Installation Guide Provides information on how to install the various components of SST/OB.
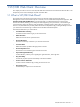
1 SST/OB Web Client: Overview This chapter provides an overview of the SST/OB Web Client and lists the main features the software offers. The chapter also points out the advantages SST/OB web Client offers. 1-1 What is SST/OB Web Client? The infrastructure supporting the Terminal environment can be both complex and extremely diverse. Management of such an environment requires a consistent, service oriented and Enterprise fluent approach.
Figure 1-1 SST/OB Web Client 1-2 Features & Benefits Real-Time Monitoring SST/OB Web Client provides the monitoring of the Terminal environment through the following methods: • Terminal data file based monitoring • Event based monitoring Together, they ensure round-the-clock real-time monitoring of precious Terminal network. SST/OB Web Client provides the latest information about Terminals in real-time such as acknowledged and closed Terminals.
Information at Your Fingertips • General • Events • Cash • Faults • Transactions • Action History • Custom Information • Map • Messages • Charts You can further select individual tabs to get detailed information. Ability to Acknowledge Events SST/OB Web Client provides the facility to Acknowledge. Unacknowledge, and Close problems on Terminals. It allows users to manage problems that have been resolved.
2 Getting Started This chapter details the steps to get started with the SST/OB Web Client. SST/OB Web Client provides a platform and location independence by giving the ability to monitor the Terminal transactions through a web-browser like the Microsoft Internet Explorer. NOTE: In case if you are accessing SST/OB Web page using Microsoft Internet Explorer, you should turn off the popup blocker feature. This topic provides information on how to access SST/OB Web Server.
Associated with each logon is a profile, which determines the information a user can view or the actions a user can take. The admin logon has special privileges. These privileges are set by default for the admin user. You need to enter the user name and the password in the User Name and Password fields respectively, to access the SST/OB Web Client. NOTE: The default administrator User Name is admin and Password is blank. The authenticity of the information specified is checked.
3 SST/OB Web Client: Concepts 3-1 SST/OB: Overview SST/OB Web client is a natural extension of SST/OB desktop client, providing platform and location independence. With the SST/OB Web Client, you can monitor your Terminal environment (configured through the SST/OB Client) through a web-browser like the Microsoft Internet Explorer. This empowers you with the “Anytime-Anywhere” access to your Terminal environment. In the next topics in the chapter, we will be covering the basic building blocks of SST/OB.
3-2-2 Local View Local Views display information that is used for general monitoring of the terminal environment. Unlike the Policy Views, you cannot specify actions for a Local View. Pre-Defined Local Views • BASE24 Network Chart: Graphical representation of counts of Terminals down due to BASE24 failures. • BASE24 Network Statistics: Statistics of Terminals for BASE24 faults. • Network-wide View: Network-wide view of Terminals “In Service”, “Out of Service” and “Blacklisted” (Out of Monitoring).
3-3 Dashboards 3-3-1 Overview SST/OB Web Client Dashboards provide you business intelligence across all areas of your Terminal environment. SST/OB Web Client comes with a range of pre-defined dashboards. Each dashboard can contain one or more views, which are governed by policies. Each Policy View in a dashboard contains Terminals under the criteria set by the corresponding Policy. A Dashboard can also contain one or more Local Views.
Table 3-1 Pre Defined Dashboards S. No Dashboard Name Views Available 9 Statistics by Line Process Statistics by Line Processes Local View 10 Statistics by Logical Network Statistics by Logical Networks Local View 11 Statistics by Region Statistics by Regions Local View 12 Statistics by Resource Node Statistics by Resource Nodes Local View 13 Statistics by State Statistics by States Local View 14 XPNET Graphs Terminals Count Vs.
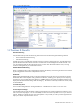
4 SST/OB Web Client Application 4-1 SST/OB Web Client Interface When you login to the SST/OB Web Client: Dashboards page is displayed by default. Figure 4-1 SST/OB Web Client Interface The Navigation area on the left side of the page provides access to the various functionalities of the SST/OB Web Client. The options available are: • Dashboards: The Dashboards option provides snap-shots on your Terminal environment. • Search: The Search option displays information based on the specified search criteria.
4-2 Dashboards 4-2-1 Overview You can view all the pre-defined Dashboards along with the user-defined Dashboards created using the SST/OB Client through the SST/OB Web Client. Select the Dashboard and the corresponding View from the Navigation area to display the details in the Details area. Selecting a Terminal from the Details area provides Terminal details in the Drill-Down area.
4-2-2 Dashboard Views Each dashboard can contain one or more views. Each Policy View in a dashboard contains Terminals under the criteria set by the corresponding Policy. A Terminal can be displayed in multiple Policy Views, in case they fulfill conditions in multiple Policies. Click on a Dashboard View from the Dashboards Navigation area to view the details on the View in the Details area. Figure 4-3 Dashboard View – Hardware Problems Use the and the icons to navigate between pages in a view.
4-3 Taking Actions on Problems The Terminals displayed in a Policy View can have the following status: • Acknowledged • Unacknowledged • Closed 4-3-1 Acknowledging a Problem Acknowledging a current problem on a Terminal displayed in a Policy View will prevent new alert notifications from being generated until the problem is unacknowledged or the underlying problem is closed. Follow the steps listed below to acknowledge a problem. 1.
3. Click on the OK button to continue Once a Terminal in a view is acknowledged, the acknowledged Terminals are displayed with the Acknowledged flag. Figure 4-6 Acknowledge Problems Option - Result Once a problem has been acknowledged, you can perform the following actions on it depending on the status of the problem.
4-3-2 Unacknowledging a Problem Follow the steps listed below to remove the existing acknowledgment for a Terminal. 4. Right-click on a Terminal in a Dashboard View Details area and select the Action ÆUnacknowledge Problems . NOTE: Only the Acknowledged Terminals can be Unacknowledged. Figure 4-7 Unacknowledge Problems Option 5. The Unacknowledge Problems dialog box is displayed. In the Reason/Description box, specify the reason for unacknowledging the problem on the selected Terminal.
4-3-3 Closing a Problem Follow the steps listed below to remove the existing acknowledgment for a Terminal and close the problem: 1. Right-click on a Terminal in a Dashboard View Details area and select Actions Æ Close Problems. 2. Selecting the option displays Close Problems dialog box. In the Reason/Description box, specify the reason for closing the problem on the selected Terminal. Figure 4-9 Close Problems Dialog Box 3. Click on the OK button.
4-4 Terminal Details SST/OB Web Client enables you to view the details of individual Terminals. Click on a Terminal in the Terminal Details area to view the detailed information corresponding to the selected Terminal.
The General tab displays information related to the selected Terminal. This information is configured by the admin user from the SST/OB Desktop client. There are various fields already available in the SSTOB database that are available in this tab for viewing. Apart from this more fields can be added by the “Admin” user manually using the SST/OB desktop client and the “Manage Data” facility.
4-4-2 Events Tab The Events tab displays the events received for the selected Terminal. Figure 4-12 Events Tab The following event information is displayed: • Generated at • Received at • Event number • Text • SSID • Subject • Manager • Cause • Remedy 4-4-3 Cash Tab The Cash tab displays the cash status for the selected Terminal.
4-4-4 Faults Tab The Faults tab displays the faults at the selected Terminal. Figure 4-14 Faults Tab The following information is available under the Faults tab: • Type • Fault • Reported At • Details 4-4-5 Transactions Tab The Transactions tab displays the transactions occuring at the selected Terminal in close to real time. These transactions are pulled in from the ATMTA database. So for information to be displayed in this tab, ATMTA product must be installed and configured.
• Card Issuer Logical Network • Card Issuer FI • Acquirer Branch • Acquirer Region • Envelope/Check used • From account • To account 4-4-6 Action History Tab The Action History tab displays the actions executed like operator actions or commands on the selected Terminal. Specify the time interval for which the history is required using the Show history for drop-down list. You can choose from Last one hour, Last 24 Hours and Last 48 Hours. Use the Refresh button to refresh the history details.
4-4-7 Custom Information The Custom Information tab provides the custom information about the record selected in a view. It could be processed information about a terminal or some external information pulled into the view to assist operations staff. The Custom information which a user can view is dependent on the privileges and rights provided by the Administrator. For example screenshot below displays transaction data form ATMTA database in the custom information tab.
4-4-9 Messages Tab Messages tab provides SSTOB web server application log. Figure 4-19 Messages Tab 4-4-10 Charts Tab The Charts tab represents the tabular numeric data in the graphical format. The Views in the Dashboards that contain charts are depicted using icon. Figure 4-20 Charts Tab The charts are visible under the following Dashboards: BASE24 Network Dashboards: Chart is available for the BASE24 Network Chart Local View. The parameters available include Count and Category of Terminals.
4-5 Search The Search feature in SST/OB Web Client allows you to find terminals or group of terminals by specifying search criteria. To access Search option, click on the Search tab in the Navigation area. Figure 4-21 Search Option Use the Locate by and Look for fields in the Search Navigation area to search the Terminal based on the criteria specified. You can search for Terminals on the basis of the following criteria using the Locate by field: • Name: Refers to the name of the Terminal.
4-6 Event Log An event is any significant occurrence in the system or in a program that requires users to be notified, or an entry added to a log. With the Event Log feature, you can obtain information about your hardware, software, and system components, and monitor security events. Event logs can help you identify and diagnose the source of current system problems, or also helps you to predict potential system problems. To access the Event Log feature, click on the Event Log tab in the Navigation area.
4-7 Browsers SST Operations Bridge Web Client provides a feature of browsing faults and events on the terminals in the specified time frame. The Browser tab has two options • Events Browser • Faults Browser 4-7-1 Events Browser Events Browser feature enables you to display the events occurred in the business environment using various filter conditions. To access Events Browser, click on the Open Events Browser option. This displays the Parameters for: Events Browser tab page.
Click on the Show button to display the events generated as per the specified criteria. Figure 4-24 Operations Bridge Web Client Events Browser Window 4-7-2 Faults Browser Faults Browser feature enables you to display the faults occurred on Terminals. To access Faults Browser, click on the Open Faults Browser tab. By default the Parameters for: Faults Browser tab page is displayed.
For viewing the Faults, following filters feilds are available: • Terminals: Select the Terminals check box to apply the fault conditions on the specific Terminals or Terminal Sets. Selecting From a Terminal Set drop-down box will automatically display the list of existing Terminal Sets. All Terminals are selected by default. • Fault ID: Select the Fault ID check box to display faults with a specific fault ID. Specify the Fault ID from the existing drop-down list.
4-7-3 Customizing Data using Filters SST/OB web client provides you with a feature to apply multiple conditions to customize your faults and events data as per the requirements. Follow the steps given below to customize faults/events data: 1. Click on the Create Filter button in the Faults/Events Browsers tab page Figure 4-27 Parameters for: Events Browser 2. The Filter builder dialog box is displayed.
3. You can also add a new condition using the And button. Figure 4-29 Filter Builder Dialog Box Figure 4-30 Filter Builder Dialog Box ] Click on the OK button to apply the changes. The result will be displayed in the Events Browsers tab. Figure 4-31 Parameters for: Events Browser NOTE: You can also group the data by dragging the column header to the “Drag a column header here to group by that column” area. NOTE: You can also sort the data by clicking on the column headers.
SST/OB provides a remarkable add-on feature of Reports in SST/OB Web server .This feature facilitates you to generate and view pre-canned reports. For generating reports you need to select duration for which reports are required and pass various other parameters available.
5-2 SST Reports interface To view SST Reports, click on the Show Reports link available under Reports tab. This displays a tree control on the right side which lists all the SST reports available. SST/OB provides you the reports under the following groups: • Availability • Cash • Faults • General • Transaction NOTE: Both Cash and Transaction report groups require ATMTA product to be installed and configured with SST/OB.
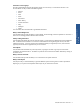
The SST Report definition is stored in a report definition file, These files are provided separately from the SST Reports installation package. These report definitions are uploaded on the SST Reports web server using the upload facility. Follow the steps given below to upload the reports: 1. Click on the Upload Report link available on the top right corner of the Reports window. Figure 5-2 SST/OB Web Client Reports Window This displays the corresponding Upload Reports window. 2.
Clicking on the Browse displays the Choose File dialog box. Figure 5-4 Choose File Dialog Box Select the report and click on the Open button. 3. The path of the selected report is displayed in the Report Info field. Click on the Upload button. Figure 5-5 SST/OB Web Client Reports Window The selected report will be uploaded and displayed it in the SST Operations Bridge Web Client Reports Window.
NOTE: The Upload Report option is only available for the Admin user. NOTE: You must have “ASPNET” and “Network Service” rights on the SST Reports folder for uploading the reports. SST Reports: Overview 41 SST Reports: Overview NOTE: If the report is already uploaded, the interface will display a message to Update the existing report or to Cancel the Uploading process.
5-4 View Reports 5-4-1 Introduction SST Operations Bridge provides reports that allow you to evaluate your terminal environment status and performance, hence keeping the entire terminal network running at a maximum efficiency. The user can also view the reports as per their needs. For example, a user can view the detailed availability status of all the terminals by generating the report for the specified time interval. 5-4-2 Reports Generation Follow the steps given below to generate the reports: 1.
Displayed below is the sample availability report showing details of availability of all the terminals This report can now be exported to various formats or printed out.
5-4-3 Reports Toolbar Figure 5-8 SST Reports Toolbar The SST Reports Toolbar is displayed just below the Parameters For filed in the SST/OB Web Client Reports window. Table 5-1 SST Reports Toolbar Button Description Enables you to display the search window. Clicking on this button displays the Search dialog box. Enables you to print the report. Clicking on this button displays the Print dialog box. Enables you to print the current page of the report.
Appendix A Parameter Description ConnectionInfo Specifies the connection string parameters used for connecting SST/OB Web Client with SST/OB database. ATMTADBConnectionInfo Specifies the connection string parameters used for connecting SST/OB Web Client with ATM/TA database. ClientMapAPI Specifies the type of map to be used by SST/OB Web Client Values: For Google map=gmap For Microft virtual earth = vemap gmapAPISrc Specifies the URL for gmap. vemapAPISrc Specifies the URL for vemap.
Parameter Description DispNodeRelInfoInNodeTime Displays NodeTime Settings as: • 0 to display Node time in UTC • 1 to display Node time in LCT Default value 0. IPPSearch It Controls information display per page under Search Option. Default value 10. IPPView It controls Number of Terminals per page to show in Detail Area in SSTOB web against selected View.Default value 10.
Appendix B SST Reports Web Configuration Parameters Description ConnectionInfo Specifies the connection string parameters used for connecting SST Reports with SSTOB database. ATMTADBConnectionInfo Specifies the connection string parameters used for connecting SST Reports with ATM/TA database. AvailabilityReportCellsInfo Cells on which the drill down will be provided, on availability reports. There is a fixed format for providing the cells info: CellName:CellHeader:Category.
Document Feedback Form We would appreciate your comments on the SST Operations Bridge Web Client Guide. After you have read the Guide and used the software, please take a few moments to complete this form and return it to appropriate HP product support service. 1. The organization of the Guide makes it easy to locate topics quickly. Strongly Disagree 1 2. Strongly Agree 2 3 4 The appearance of the pages makes it easy to locate information quickly. Strongly Disagree 1 3.
9. The level of writing in this book is: Too Basic Just Right Too Technical (Please be specific.) Do you have any other suggestions for improvement? Document Feedback Form 10.