
SST Operations Bridge Web Client Guide, Version 1.1


SST/OB Web Client: Concepts 14
3-3 Dashboards
3-3-1 Overview
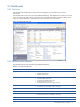
SST/OB Web Client Dashboards provide you business intelligence across all areas of your Terminal
environment.
SST/OB Web Client comes with a range of pre-defined dashboards. Each dashboard can contain one or more
views, which are governed by policies. Each Policy View in a dashboard contains Terminals under the criteria
set by the corresponding Policy. A Dashboard can also contain one or more Local Views.
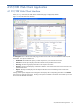
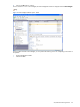
Figure 3-1 Dashboards Main Page
3-3-2 Pre-Defined Dashboards
SST/OB Web Client provides the following pre-defined Dashboards:
Table 3-1 Pre Defined Dashboards
S. No Dashboard Name Views Available
1 BASE24 Network Dashboard • BASE24 Network Statistics
• BASE24 Network Chart
• BASE24 Network Policy
2 Monitoring • Printer/Paper/Other Supply Problems Policy View
• Cashout Problems Policy View
• Communication Problems Policy View
• Hardware Problems Policy View
• In Maintenance (in Supervisor mode) Policy View
3 No Transactions on Terminals • No Transaction for more than 12 hours Local View
• No Transaction for more than 24 hours Local View
4 Out of Service Out of Service Policy View
5 Overall Status Graph Network-wide View Local View
6 Region based Monitoring • Terminals Out of Service – Region wise Local View
• Terminals Out of Service Count/Region Local View
7 Statistics by City Statistics by Cities Local View
8 Statistics by Device Handler Statistics by Device Handlers Local View