
SST Operations Bridge Web Client Guide, Version 1.1


SST/OB Web Client Application 16
4 SST/OB Web Client Application
4-1 SST/OB Web Client Interface
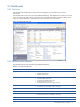
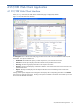
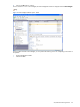
When you login to the SST/OB Web Client: Dashboards page is displayed by default.
Figure 4-1 SST/OB Web Client Interface
The Navigation area on the left side of the page provides access to the various functionalities of the SST/OB
Web Client. The options available are:
• Dashboards: The Dashboards option provides snap-shots on your Terminal environment.
• Search: The Search option displays information based on the specified search criteria.
• Event Log: The Event Log displays information with respect to the events.
• Browsers: The Browser tab displays information related to various faults and events on the terminals in the
specified time frame.
• Reports: The Reports tab displays the SST Reports about the terminal availability, faults and the cash
management.
Clicking on the options displayed in the Navigation area displays the corresponding information in the Details
area on the top right side of the page. Clicking on the options available in the Details area enables you to drill-
down further for detailed information.